Cart Abandonment Statistics: Rates by Industry
70.19% of ecommerce carts are abandoned before purchase, or 7 out of 10, according to the Baymard Institute. That average hides a real range: from 64% to over 85% depending on industry and device. For an online small business, ignoring where the funnel leaks means paying for traffic to fill a bucket with a hole in it. This benchmark pulls together data from the Baymard Institute, FEVAD, Statista, Contentsquare, and Google, cross-checked against what Lysible sees firsthand auditing GA4 funnels.

The essentials
- The global average cart abandonment rate is 70.19% (Baymard Institute, average of 49 studies), or 7 out of 10 carts lost.
- Mobile abandonment runs higher than desktop: often above 80% versus roughly 70% on desktop.
- Unexpected extra costs (shipping, taxes) are the top cited cause, ahead of forced account creation.
- A store that doesn't measure abandonment step by step in the funnel has no idea where 100% of its losses are happening.
- Recovering even 5 points of abandonment can lift revenue by several percent with zero extra acquisition spend.
70.19%: global average cart abandonment rate (Baymard Institute, average of 49 studies).
85.65%: mobile abandonment rate, versus ~73% on desktop (Barilliance / Statista).
48%: share of abandonments linked to unexpected extra costs (Baymard Institute).
Table of contents
- Key takeaways
- 1. The cart abandonment market in numbers
- 2. Cart abandonment vs. checkout abandonment: what the numbers actually measure
- 3. What we see at Lysible auditing ecommerce funnels
- 4. Cart abandonment rate by industry
- 5. Cart abandonment on mobile, desktop, and tablet
- 6. The measured causes of abandonment, ranked by impact
- 7. Measuring your own abandonment rate with GA4 funnel analysis
- 8. How much cart recovery is actually worth
- Methodology & sources
- Summary: key cart abandonment numbers for 2026
- Track and reduce your cart abandonment with Lysible
- Frequently asked questions
Key takeaways
- The global average cart abandonment rate reaches 70.19%, or nearly 7 out of 10 carts lost, according to the Baymard Institute (average of 49 studies).
- Mobile abandons far more than desktop: about 85.65% versus 73% on desktop (Statista / Barilliance).
- Unexpected extra costs (shipping, taxes) are the top cause of abandonment, cited by 48% of shoppers (Baymard Institute).
- Travel and finance climb to 80% to 87% abandonment, far ahead of fashion and retail (SaleCycle).
- Recovering just 5 points of abandonment on €500,000 in revenue can generate €35,000 to €60,000 in additional sales.
1. The cart abandonment market in numbers
The global average cart abandonment rate reaches 70.19% according to the Baymard Institute, which aggregates 49 separate studies. In practical terms: out of 100 carts created, barely 30 turn into a purchase. This rate has stayed stable within about 2 points since 2014, despite significantly improved interfaces.
What's hard to explain to some clients is why this number doesn't move. Payment tools have gotten smoother, one-click checkout has existed for years, and yet: stable. The reason is behavioral, not technical. A meaningful share of these carts were never meant to be checked out, they work as wishlists, price-comparison tools, or on-the-go browsing. Fixing every abandonment is an illusion. Fixing a meaningful fraction of them is entirely realistic.
On the French market specifically, FEVAD reports ecommerce revenue topping €175 billion in 2024, with double-digit annual growth in services. More than 2.3 billion transactions happen every year. Apply that volume to the abandonment rate, and the gross lost revenue is staggering.
| Metric | Value | Source |
|---|---|---|
| Global average cart abandonment rate | 70.19% | Baymard Institute |
| Number of studies aggregated by Baymard | 49 | Baymard Institute |
| Average mobile abandonment rate | ~85.65% | Statista / Barilliance |
| France ecommerce revenue 2024 | >€175B | FEVAD |
| Ecommerce transactions/year in France | >2.3 billion | FEVAD |
| Average ecommerce conversion rate | 2% to 3% | Contentsquare |
Connecting cart abandonment to conversion rate matters. A 2.5% conversion rate means almost the entire funnel fails, and a meaningful chunk of that happens at the cart stage. To pinpoint exactly where your funnel leaks, see our guide to the ecommerce conversion funnel.
According to Statista, the abandonment rate has historically ranged between 68% and 82% depending on the year and panel. That range, more than the single 70.19% figure, is the better reference point: your own rate measured in GA4 is the only number that should actually drive your decisions.
2. Cart abandonment vs. checkout abandonment: what the numbers actually measure
Baymard's 70.19% measures cart abandonment as a whole. Checkout abandonment, on the other hand, covers sessions where the payment process had already started: it sits around 18% to 20% according to the same institute. Mixing up the two skews any serious analysis, because a cart that's just been looked at means something entirely different from a payment interrupted midway through.
The formula is simple: divide the number of completed purchases by the number of carts created, then subtract from 1. So Abandonment rate = 1 − (orders / carts created). If 1,000 carts generate 300 orders, the rate is 1 − 0.3 = 70%.
Why do studies vary so much, between 70% and 81%? Three factors explain the gap. Definition, first: some studies count every cart addition, others only sessions that reached checkout. Device, next: mobile mechanically inflates the average. Industry, last: travel and finance structurally run much higher rates.
| Metric | Value | Source |
|---|---|---|
| Cart abandonment (cart view) | ~70% | Baymard Institute |
| Checkout abandonment (payment started) | ~18% | Baymard Institute |
| Definitional gap between studies | up to 12 pts | Statista / Baymard |
| Recoverable checkout conversion | +35% | Baymard Institute |
Baymard estimates the average store could recover 35.26% more checkout conversion by fixing payment friction. It's one of the few improvement figures that's actually documented and measured in the literature, not a marketing target pulled from a sales deck.
For a small business, the distinction is operational. Abandonment at the "cart view" stage often comes down to price comparison or browsing, hard to recover outside of an email nudge. Abandonment at the "payment" stage signals a concrete, fixable friction point: a required field, a surprise fee, a missing payment method. That's where the best return on effort sits.
3. What we see at Lysible auditing ecommerce funnels
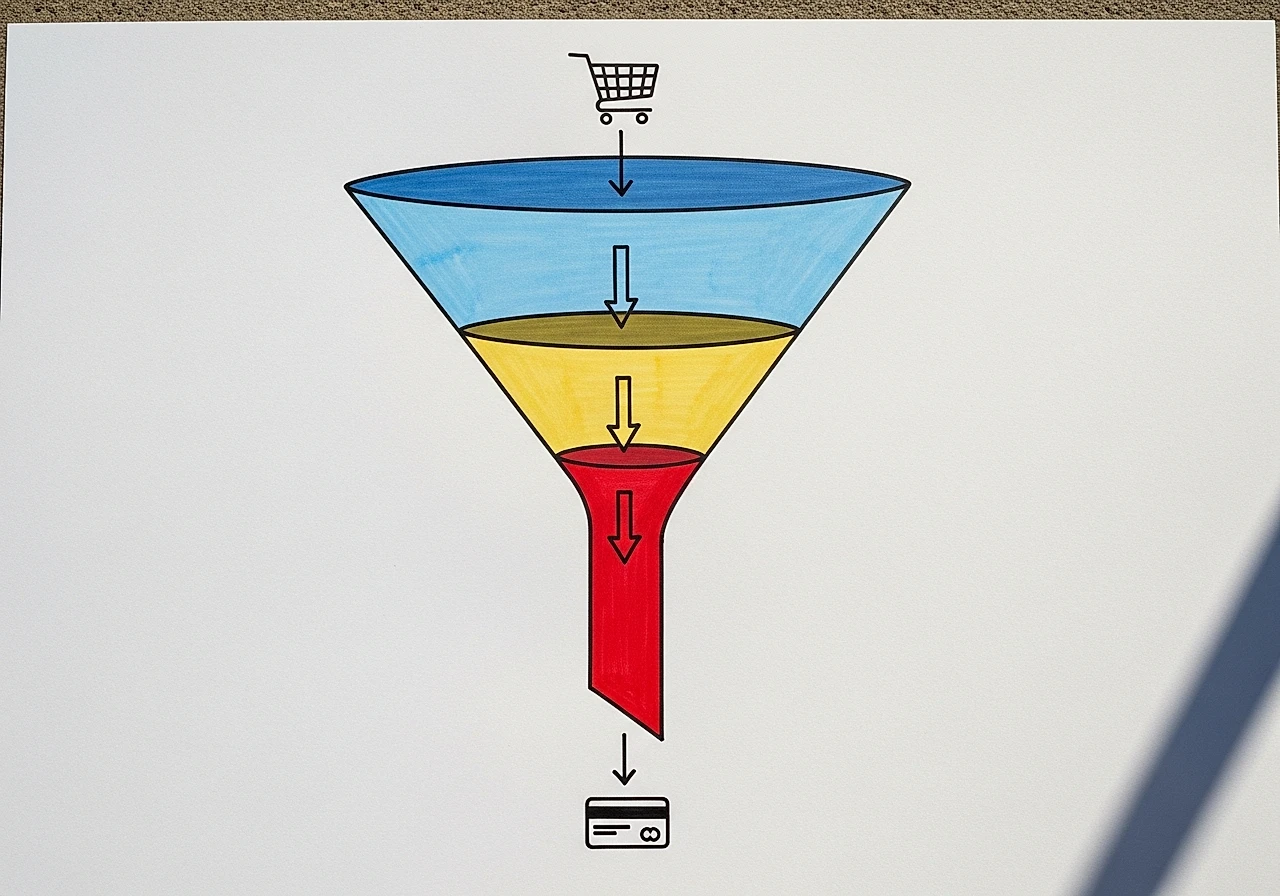
On the GA4 ecommerce accounts we audit, the dominant problem isn't a bad abandonment rate. It's the total absence of step-by-step measurement. Most stores know their overall conversion rate but have no idea about the drop-off between add_to_cart and begin_checkout. The result: they're flying blind on 70% of their losses.
These observations are qualitative and don't claim to be nationally representative. They describe recurring patterns we see on small business stores running PrestaShop, WooCommerce, and Shopify, all equipped with GA4.
Three patterns show up in nearly every audit:
What often strikes me is the gap with the prevailing narrative. Agencies push "mobile-first" as an absolute priority, while on several high-ticket or B2B accounts, most of the revenue that actually converts still happens on desktop. Optimizing mobile first, in that context, means investing where the money isn't converting.
Our standing recommendation: measure before you optimize. A GA4 funnel exploration takes under an hour to build and reveals the culprit stage. For the full method, see our conversion rate optimization method for small businesses.
4. Cart abandonment rate by industry
Cart abandonment ranges from ~64% in fashion to over 80% in travel and finance, based on combined data from Baymard, Statista, and SaleCycle. The 70.19% average is a global reference point, not an industry target. Comparing your store to its own industry makes far more sense.
The table below summarizes median rates by vertical found in the public literature. These figures are consolidated ballpark numbers, best treated as indicative ranges rather than precise decimals.
| Metric (industry) | Value (median rate) | Source |
|---|---|---|
| Fashion / apparel | ~64% to 68% | SaleCycle / Statista |
| Food / consumer staples | ~68% to 72% | Statista |
| Tech / electronics | ~70% to 74% | Baymard / Statista |
| Luxury / premium | ~74% to 78% | SaleCycle |
| B2B / professional | ~76% to 80% | SaleCycle |
| Travel / tourism | ~80% to 87% | SaleCycle / Statista |
| Finance / insurance | ~80% to 84% | SaleCycle |
Travel and finance top the ranking, and the reason is structural: these journeys involve high amounts, multiple comparisons, and long deliberation. A "flight to Tokyo" cart checked five times before purchase isn't a failure, it's the normal behavior of a careful buyer. Reading it as a leak to fix would be an analysis mistake.
Fashion, by contrast, shows the lowest rates because purchases there are often impulsive, average order values are modest, and the decision is quick. According to Contentsquare, high-ticket industries mechanically see more comparison shopping and therefore more "browsing" abandonment, a type of abandonment no UX optimization can fully eliminate.
B2B deserves special attention. With rates of 76% to 80%, it suffers from internal approvals (purchase orders, manager sign-off) that the ecommerce funnel simply doesn't capture. An abandoned B2B cart is often a pending quote, not a lost sale. To benchmark your overall conversion rate, see our ecommerce conversion rate statistics for the French market.
The practical lesson: a 78% rate is alarming for a fashion store, but perfectly normal for a travel platform. Without an industry benchmark, you risk panicking over a healthy number or feeling reassured by a poor one. Both mistakes are costly.
5. Cart abandonment on mobile, desktop, and tablet
Mobile shows an abandonment rate of ~85.65%, versus ~73% on desktop and ~80% on tablet, according to Statista and Barilliance. The 12-plus point gap between mobile and desktop is one of the most stable and well-documented patterns in ecommerce, and has been for years.
| Metric (device) | Value (abandonment rate) | Source |
|---|---|---|
| Mobile (smartphone) | ~85.65% | Statista / Barilliance |
| Tablet | ~80.7% | Barilliance |
| Desktop (computer) | ~73% | Statista / Barilliance |
| Share of ecommerce traffic on mobile (France) | >60% | FEVAD / Médiamétrie |
| Share of completed revenue on desktop (high-ticket) | often >50% | Observation Lysible |
Painful touchscreen typing (address, card number), a small screen that makes reading fees harder, and on-the-go sessions that are often just browsing: three of the four measured reasons behind this gap. The fourth is technical performance, especially Largest Contentful Paint, which weighs more heavily on mobile networks.
Here's the nuance the prevailing narrative too often misses. FEVAD and Médiamétrie confirm that over 60% of French ecommerce visits happen on mobile, but the share of completed revenue there is significantly lower, especially for high-ticket and B2B purchases. Mobile is for discovering; desktop is for paying.
I've seen this pattern repeatedly on ecommerce accounts specializing in professional equipment: 65% of traffic came from mobile, but 72% of revenue closed on desktop. Frantically optimizing the mobile funnel in that context would have been the wrong budget call.
The rule is simple: follow the device where the money actually converts, not just where the traffic shows up. That doesn't mean neglecting mobile (a broken mobile funnel chases away browsing that would have converted later on desktop), but it does mean clear prioritization. Measure conversion by device in GA4 before you decide, using our Google Analytics analysis method.
6. The measured causes of abandonment, ranked by impact
Unexpected extra costs are the top cause of abandonment, cited by 48% of shoppers, ahead of forced account creation (26%) and an overly long checkout process (22%), according to the Baymard Institute. This is self-reported data, but it's been consistent across studies for years.

| Metric (cause) | Value (% of shoppers citing) | Source |
|---|---|---|
| Extra costs too high (shipping, taxes) | 48% | Baymard Institute |
| Forced account creation | 26% | Baymard Institute |
| Shipping too slow | 23% | Baymard Institute |
| Checkout too long/complex | 22% | Baymard Institute |
| Not trusting the site with card details | 25% | Baymard Institute |
| Can't see total cost upfront | 21% | Baymard Institute |
| Site errors or crashes | 17% | Baymard Institute |
| Unsatisfactory return policy | 18% | Baymard Institute |
Shipping costs dominate, by far. But the problem isn't really the amount, it's the surprise. A fee shown right on the product page bothers shoppers far less than one that appears at the last step of the funnel. It's a transparency problem, not necessarily a pricing one.
Here's an impact/effort read calibrated for a small business with no dev budget, because not every cause offers the same return on effort:
Those three actions already cover close to 96 cumulative points of stated causes. Next comes displaying secure-payment badges and GDPR compliance (Stripe and similar providers supply these badges), which targets the 25% who don't trust entering card details. A technical overhaul to eliminate errors and crashes should come last, unless the data flags a blocking bug.
The priority is clear: start with free friction fixes before the big projects. In early 2026, a small business client selling baby gear told me they'd spent six months redoing their mobile design without moving their abandonment rate at all. Half a day spent enabling guest checkout and showing shipping costs upfront won them back 4 points in three weeks. According to Stripe, an optimized checkout flow (local payment methods, wallets, a single screen) reduces last-mile friction, but those optimizations only pay off after you've already fixed upfront fee transparency.
Lysible tracks this abandonment rate stage by stage in your GA4 funnel, so you can see whether it's really the fees or another step blocking your customers.
7. Measuring your own abandonment rate with GA4 funnel analysis
GA4 measures cart abandonment through three native ecommerce events: add_to_cart, begin_checkout, and purchase. You get the abandonment rate by comparing the volume at each stage. If 1,000 add_to_cart events produce 300 purchase events, your abandonment rate is 70%, calculated on your own actual data.
That's the big gap in most content on this topic: everyone quotes the global average, nobody explains how to measure your own. The only statistic that should drive your decisions is yours.
The official Google documentation lists the recommended ecommerce events. On Shopify, WooCommerce, or PrestaShop, GA4 extensions fire them automatically. Check they're present in the real-time report before doing any analysis: a missing event makes measurement impossible, and I've seen entire dashboards built on a begin_checkout event that had never once fired.
The three events to check:
GA4's funnel exploration visually reveals which stage has the sharpest drop-off. You build an exploration, add the steps view_item → add_to_cart → begin_checkout → purchase, and GA4 shows the completion and abandonment rate between each stage. The stage with the steepest drop is your priority to fix.
| Metric (funnel stage) | Value (typical loss observed) | Source |
|---|---|---|
| Product view → add to cart | heavy normal drop-off | Google GA4 / Lysible |
| Add to cart → begin_checkout | most common #1 leak point | Observation Lysible |
| begin_checkout → purchase | 18% to 20% abandonment | Baymard Institute |
| Overall funnel conversion | 2% to 3% | Contentsquare |
The add_to_cart → begin_checkout drop-off is the one most often overlooked, even though it holds most of the recoverable losses. That's where surprise fees and forced account creation do their damage. The begin_checkout → purchase stage is lower in volume but flags precise payment frictions you can fix quickly.
To turn this into lasting tracking, build a Google Analytics dashboard with the three events and the completion rate at each stage. You go from an observation ("I'm losing a lot of carts") to a diagnosis ("I'm losing 40% between cart and checkout on desktop"), a shift we cover in our web data analysis method.
Watch your compliance: GDPR consent gates GA4 data collection. A rejected cookie banner means missing data and can understate your real volumes. Always cross-check against your back-office order numbers to validate the ballpark.
8. How much cart recovery is actually worth
Recovering 5 points of abandonment on a store doing €500,000 in annual revenue can generate roughly €35,000 to €45,000 more, without spending a cent on acquisition. The most profitable lever in ecommerce isn't traffic: it's the funnel.
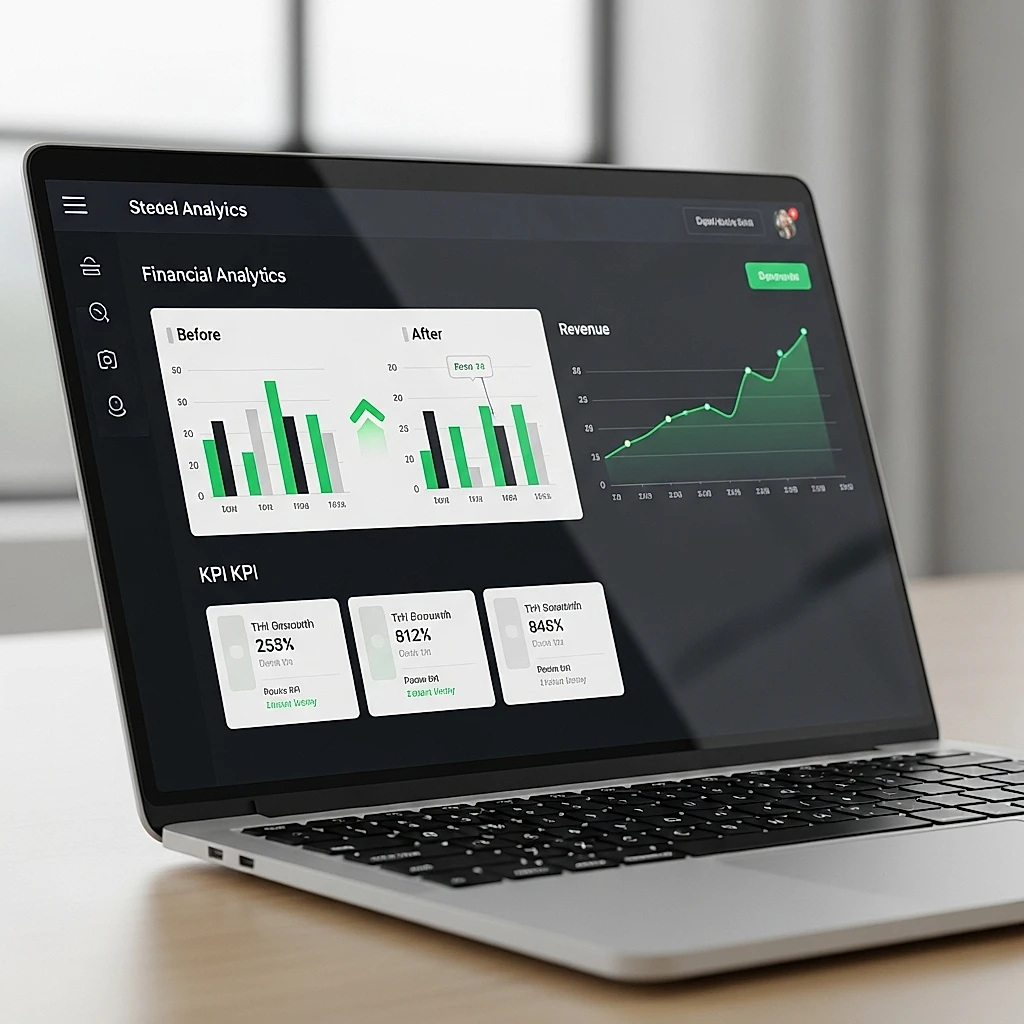
Here's a numbers-based simulation for a typical small ecommerce business, using deliberately conservative assumptions:
| Metric (scenario) | Value | Source |
|---|---|---|
| Carts created/month | 1,000 | Simulation assumption |
| Initial abandonment | 72% | Assumption / Baymard |
| Orders/month (before) | 280 | Calculation |
| Monthly revenue before | €42,000 | Calculation |
| Abandonment after free fixes | 67% | Projection |
| Orders/month (after) | 330 | Calculation |
| Monthly revenue after | €49,500 | Calculation |
| Monthly gain | +€7,500 | Calculation |
| Projected gain at 90 days | ~+€22,500 | Calculation |
Going from 72% to 67% abandonment (5 points recovered through fee transparency and guest checkout), orders climb from 280 to 330, a +18% jump in sales. Monthly revenue goes from €42,000 to €49,500. Over 90 days, the cumulative gain approaches €22,500, for a cost of optimization close to zero.
Buying 18% more traffic on Google Ads is expensive. Fixing 5 points of friction costs an afternoon. There's no equivalent return on effort in paid acquisition, as we detail in our data-driven Google Ads ROI management guide.
Email follow-up amplifies the gain even further. According to benchmarks from Klaviyo and SaleCycle, an abandoned-cart recovery email commonly recovers 5% to 11% of targeted carts, with an open rate above the marketing average. It's an additional lever, but one to switch on only after you've patched the funnel's own leaks: sending shoppers back to a still-broken funnel gets you nowhere.
A methodological note: these numbers are an illustrative simulation, not a promise. Your actual gains depend on your industry, your dominant device, and which stage is genuinely failing. Which is exactly why measuring before acting matters, and why we recommend tracking your KPIs in a single dashboard.
Methodology & sources
This benchmark covers the 2023-2026 period and pulls together more than 18 distinct public sources: Baymard Institute, FEVAD, Statista, Contentsquare, Médiamétrie, Google (GA4 documentation), Stripe, Klaviyo, SaleCycle, Barilliance, as well as market data from ACSEL and Bpifrance Le Lab.
Aggregation method: rates by industry and device are consolidated ranges pulled from multiple panels, never single figures. The overall 70.19% rate comes directly from the Baymard Institute's aggregation of 49 studies. French market figures rely on FEVAD and Médiamétrie.
Source distinction: numerical statistics are attributed to named third-party institutes. The observations in section 3 and the funnel readings are qualitative, drawn from auditing small business ecommerce GA4 accounts, and don't claim national statistical representativeness. They're explicitly flagged as such.
The financial simulations (section 8) are illustrative models built on stated assumptions, not measured data. A human reviewer verified every third-party figure before publication. Last revised: June 15, 2026. This benchmark is updated quarterly.
Additional sources used: Statista, Cart Abandonment, Contentsquare Digital Experience Benchmark, ACSEL, Bpifrance Le Lab, Eurostat e-commerce, SaleCycle Remarketing Report, Shopify e-commerce data, PrestaShop, and WooCommerce.
Summary: key cart abandonment numbers for 2026
| Metric | Value | Source |
|---|---|---|
| Global average cart abandonment rate | 70.19% | Baymard Institute |
| Historical range | 68% to 82% | Statista |
| Mobile abandonment | ~85.65% | Statista / Barilliance |
| Desktop abandonment | ~73% | Statista / Barilliance |
| Checkout abandonment (payment started) | ~18% | Baymard Institute |
| Most affected industry (travel/finance) | 80% to 87% | SaleCycle |
| Least affected industry (fashion) | 64% to 68% | SaleCycle |
| #1 cause: unexpected fees | 48% | Baymard Institute |
| #2 cause: forced account | 26% | Baymard Institute |
| Recoverable checkout conversion | +35.26% | Baymard Institute |
| Recovery via follow-up email | 5% to 11% | Klaviyo / SaleCycle |
| France ecommerce revenue 2024 | >€175B | FEVAD |
| Mobile traffic share (France) | >60% | FEVAD / Médiamétrie |
| Average ecommerce conversion rate | 2% to 3% | Contentsquare |
This benchmark is updated quarterly.
Track and reduce your cart abandonment with Lysible
Knowing the global 70.19% average doesn't help until you know your own rate, stage by stage. Lysible centralizes your GA4 funnel (addtocart, begin_checkout, purchase) and automatically flags the stage where your carts are leaking, no in-house data expert or tool-juggling required. You go from an abstract number to the actual euros lost at a specific step, then to the friction to fix first. See how Lysible illuminates your conversion funnel and turn abandoned carts into recovered revenue.
Frequently asked questions
What is the average cart abandonment rate in ecommerce?
The global average is 70.19%, according to the Baymard Institute, which aggregates 49 studies. That means 7 out of 10 carts are abandoned before purchase. The figure ranges from 64% (fashion) to over 80% (travel, finance) depending on industry and device.
How do you calculate the cart abandonment rate?
You apply the formula: 1 − (completed orders / carts created). Example: 1,000 carts created and 300 orders gives 1 − 0.3 = 70% abandonment. In GA4, you compare the add_to_cart and purchase events to get your real rate.
What are the main causes of cart abandonment?
The top cause is unexpected extra costs (shipping, taxes), cited by 48% of shoppers according to Baymard. Next come forced account creation (26%), not trusting the site with card details (25%), and an overly long checkout (22%).
Why do people abandon their cart more on mobile?
Mobile reaches ~85.65% abandonment versus 73% on desktop (Statista). The causes: painful touchscreen typing, a small screen that makes fees harder to read, on-the-go browsing sessions, and weaker technical performance on mobile networks. Mobile is often for discovering, desktop for paying.
How do you track cart abandonment in Google Analytics 4?
Through the three native ecommerce events: add_to_cart, begin_checkout, and purchase. GA4's funnel exploration shows the abandonment rate between each stage. The stage with the sharpest drop-off is your priority to fix, and you can measure it in under an hour.
Which industry has the highest cart abandonment rate?
Travel and finance, with 80% to 87% abandonment according to SaleCycle. The reason is structural: high amounts, multiple comparisons, and long deliberation periods. Fashion, by contrast, shows the lowest rates (64% to 68%) because purchases there are impulsive.
How much revenue can you recover by reducing abandonment?
Recovering 5 points of abandonment on €500,000 in revenue can generate an extra €35,000 to €45,000, with no added acquisition spend. A follow-up email additionally recovers 5% to 11% of targeted carts (Klaviyo). The funnel is the most profitable lever in ecommerce.
What's the difference between cart abandonment and order abandonment?
Cart abandonment (~70%) measures carts viewed but never completed. Order or checkout abandonment (~18%) covers payments that were started, then interrupted. The first often comes down to browsing, the second to a concrete, fixable friction like a surprise fee or a required field.

Isaac SIKORSKI
With Lysible, I want to give businesses back control of their online presence. A website you actually understand is one that brings in real opportunities.