E-commerce Conversion Rate Statistics: France Benchmarks 2026
The median ecommerce conversion rate in France runs between 1.5% and 3% depending on the sector, while the top 20% of stores clear 3.2%. The gap is stark: most traffic comes from mobile, yet mobile converts up to 74% worse than desktop. For a small business, gaining 0.6 points of conversion can change an entire season's profitability. This report pulls together data from Fevad, Contentsquare, Shopify, Baymard Institute, and Statista, cross-checked against Lysible's own field observations on the ecommerce accounts we audit.

The essentials
- The median ecommerce conversion rate in France ranges between 1.5% and 3% depending on the sector, according to Fevad benchmarks.
- The top 20% of stores clear a 3.2% conversion rate, and the top 10% of Shopify merchants reach 4.7%.
- Mobile converts on average 74% worse than desktop, despite carrying most of the traffic, according to Contentsquare.
- The average return rate in France reached 24% in 2023-2024, a hidden cost that eats into real profitability.
- French ecommerce came close to €200 billion in revenue in 2025, up 9.6% year over year according to Fevad.
1.5% to 3%: the median conversion rate by sector in France (Contentsquare, Fevad). 74%: the mobile/desktop conversion gap on the most affected accounts (Contentsquare). €200bn: French ecommerce revenue nearly reached in 2025, up 9.6% year over year (Fevad).
Table of contents
- Key takeaways
- 1. How to read these numbers: sources, scope, and method
- 2. What is the average ecommerce conversion rate in France?
- 3. What we see at Lysible across the accounts we audit
- 4. Benchmarks by sector: where your store really stands
- 5. Mobile vs. desktop: the conversion gap that costs money
- 6. Return rates and cart abandonment: the forgotten numbers
- 7. The "net conversion rate": real profitability
- 8. What these statistics mean for a small business
- 9. Methodology & sources
- 10. Outlook 2026 → 2028
- Centralize your conversion benchmarks with Lysible
- Frequently asked questions
Key takeaways
- The median ecommerce conversion rate in France sits between 1.5% and 3% depending on the sector, according to Contentsquare and Fevad benchmarks.
- The top 20% of stores clear 3.2% conversion, and the top 10% of Shopify merchants reach nearly 4.7%.
- Mobile carries most of the traffic but converts up to 74% worse than desktop, according to Contentsquare.
- The average return rate in France reached around 24% in 2023-2024 in sectors like fashion, a hidden cost that eats into margin.
- The average cart abandonment rate is close to 70%, according to Baymard Institute's consolidated average across 49 studies.
1. How to read these numbers: sources, scope, and method
No single number sums up the French ecommerce conversion rate. Depending on the calculation method and sample used, the reference value ranges from 1% to over 3%. Knowing where each benchmark comes from keeps you from comparing apples to oranges, and drawing the wrong conclusions for your own store.
Three types of sources dominate this topic. Fevad, the official federation of French ecommerce, publishes macro volumes: revenue, transaction counts, and average order value, based on its members' declarations. Contentsquare measures actual session behavior through its Digital Experience Benchmark, drawn from billions of analyzed interactions. Shopify aggregates performance across its merchants, mostly SMBs and DNVBs.
The trap lies in the denominator. A conversion rate can be calculated on sessions (every visit counts) or on unique visitors (a buyer who returns three times counts once). At identical traffic, the "unique visitors" base mechanically produces a higher rate. Google Analytics 4 calculates on sessions by default, which is why most business owners work from that base.
Geographic scope matters just as much. A global Shopify benchmark blends highly mature markets (the UK, the US) with less advanced ones: the median doesn't transfer directly to France. According to Statista, the average global ecommerce conversion rate stays under 2.5%, but country-to-country gaps reach several points.
One last factor not to overlook: seasonality. The rate spikes during Black Friday and sales periods, then drops outside promo windows. An annualized figure smooths out these peaks. To interpret your own rate, always compare one period to the same period the previous year. Our guide to marketing KPIs for small businesses explains how to frame each metric before you start tracking it.
The rule to remember: a benchmark is only useful if you know its denominator, its scope, and its time period. Without these three elements, the number is unusable.
2. What is the average ecommerce conversion rate in France?
The average ecommerce conversion rate in France sits within a consolidated range of 1.5% to 3%, depending on sector and device. The multi-source median hovers around 2%, which means one store in two converts fewer than two visitors out of a hundred into buyers.
A few benchmarks frame the analysis. Clearing 3% puts a store in the top quarter of the market, according to Contentsquare. The top 20% breaks 3.2%, and among the best-performing Shopify merchants, the top 10% reaches nearly 4.7%. On the flip side, a rate that stays under 1% signals unqualified traffic or a broken purchase funnel.
| Indicator | Value | Source |
|---|---|---|
| Median conversion rate, France | ~2% | Contentsquare |
| Top 20% of stores | > 3.2% | Contentsquare |
| Top 10% Shopify merchants | ~4.7% | Shopify |
| Global average rate | < 2.5% | Statista |
| "Underperformance" threshold | < 1% | Field observation |
Critical interpretation matters here. A 2% rate is neither good nor bad in absolute terms: it depends on average order value, margin, and acquisition cost. A store converting at 1.2% with a high order value can be more profitable than a store at 3% with thin margins. Conversion rate is never read in isolation.
The recent trend is modest but real. According to Fevad, French ecommerce came close to €200 billion in revenue in 2025, up 9.6% year over year. That growth mostly comes from transaction volume and services, not a jump in conversion rate, which has stayed structurally stable around 2% for several years.
Transaction volume topped 2.5 billion orders in 2024 according to Fevad, with average order value squeezed by inflation to around €65 for products. This rate stability despite rising traffic confirms one point: French merchants' main growth lever is still acquisition, not yet conversion rate optimization (CRO), a field still largely untapped by small businesses.
According to Bpifrance Big Media, France now counts more than 200,000 active online stores, which intensifies competition and pulls conversion rates down for new entrants. The denser the market gets, the more differentiation through user experience matters.
3. What we see at Lysible across the accounts we audit
Across the ecommerce accounts we audit, the most common conversion blocker isn't price, it's traffic quality. Many small businesses buy poorly qualified clicks, which inflates sessions and mechanically depresses the conversion rate, without saying anything about the funnel's actual performance.
Our qualitative field observations line up with public benchmarks on several points. First, a recurring mix-up over the calculation base: many business owners compare a GA4 rate calculated on sessions to a sector benchmark calculated on unique visitors, and wrongly conclude they're underperforming. This misreading is one of the most common we see in our audits.
Next, mobile carries most of the traffic but only a minority share of revenue on high order value accounts. On these stores, desktop remains the margin engine, even as the dominant narrative pushes for mobile-first everything. We come back to this in section 5, backed by public data.
A third recurring issue: conversion tracking is often misconfigured. Duplicate tags, purchase events firing twice, cross-domain conversions that never get stitched together. The result: the reported rate is wrong before any analysis even starts. To get this foundation right, our Google Analytics review method covers the GA4 reports worth checking first.
Finally, few small businesses connect their conversion rate to their return rate and cart abandonment rate. They manage a gross conversion figure that overstates real profitability. This chain, what we call the net conversion rate, is covered in section 7. These observations stay qualitative: they describe recurring patterns across our accounts, without claiming national statistical representativeness.
4. Benchmarks by sector: where your store really stands
Conversion rate varies sharply by vertical: from under 1% in furniture and luxury to over 3% in food and everyday products. Comparing your store to an all-sector average makes no sense; only the sector benchmark shows where you really stand.

Products bought frequently at low order value (food, beauty, health) convert better because the decision is quick and repeated. Products bought deliberately at high order value (furniture, high-end tech, travel) convert less: the decision cycle stretches across several visits, which dilutes the per-session rate.
| Sector | Median conversion rate | Source |
|---|---|---|
| Food / grocery | 2.8% to 3.5% | Contentsquare |
| Beauty & cosmetics | 2.5% to 3.1% | Contentsquare |
| Health & pharmacy | 2.3% to 3% | Statista |
| Fashion & apparel | 1.8% to 2.5% | Fevad / Contentsquare |
| Tech & electronics | 1.4% to 2.2% | Contentsquare |
| Furniture & home decor | 0.8% to 1.5% | Statista |
| Luxury & jewelry | < 1% | Contentsquare |
| Services & subscriptions | 2% to 4% | Field observation |
Food leads for a simple reason: repeat purchases and customer loyalty shorten the funnel. According to Contentsquare, consumer goods sites post the highest rates, driven by repeat orders and established customer accounts.
Fashion, the most visible sector in French ecommerce according to Fevad, converts in a mid-range bracket but suffers from a high return rate that undermines real profitability. A 2.3% conversion rate in fashion isn't worth the same as a 2.3% rate in food, because returns eat into a much bigger share of revenue there.
Tech illustrates another trap. A high order value offsets a lower rate: an electronics store at 1.5% can generate more margin than a cosmetics store at 3%. Conversion rate on its own is misleading without cross-referencing average order value and unit margin.
Furniture and luxury trail behind with rates under 1.5%, sometimes under 1%. The amount at stake and the need for reassurance stretch out the decision. For these sectors, the right metric isn't the per-session rate but the 30-day conversion rate, which captures multiple visits before purchase. Comparing your site to the right sector median is the prerequisite for any optimization: our website audit method explains how to measure this positioning.
Pinpointing exactly where your store sits on this benchmark means cross-referencing your own numbers with this sector data. Our team can walk through this with you, on the contact page.
5. Mobile vs. desktop: the conversion gap that costs money
Mobile carries most of French ecommerce traffic, over 60% of sessions according to Fevad, but converts noticeably worse: on the most affected accounts, the gap reaches 74% in desktop's favor, according to Contentsquare. This asymmetry is the central paradox of French ecommerce.

Three structural causes explain this gap. The smaller screen makes it harder to fill out payment and shipping forms, the main source of friction. Usage context plays a role too: people browse on mobile during commutes or in the evening, often while just browsing, then finalize on desktop when they have time. Think about how you yourself browse sites on the go versus at home, in front of a big screen. Finally, load speed, slower on mobile networks, weighs directly on conversion.
| Indicator | Value | Source |
|---|---|---|
| Share of mobile traffic | > 60% | Fevad |
| Desktop conversion rate | ~3% | Contentsquare |
| Mobile conversion rate | ~1.5% | Contentsquare |
| Mobile/desktop gap (affected accounts) | up to -74% | Contentsquare |
| Share of revenue from desktop (high order value) | majority | Field observation |
Here's the counter-argument benchmarks often miss. The dominant narrative pushes for mobile-first, on the grounds that traffic is mostly mobile. Except on the high order value accounts I regularly audit, desktop often generates most of the margin. Mobile works as a discovery channel; desktop, as a conversion channel. Optimizing only for mobile would mean neglecting where the money actually comes in.
This nuance depends on the sector. For a cosmetics store with low order value and impulse buying, mobile converts decently and deserves priority. For a furniture or high-end tech store with a high order value, desktop remains decisive. According to Google CrUX, mobile speed remains a major conversion factor, but it's not enough on its own to reverse cross-device usage patterns.
The right read comes from attribution. A purchase finalized on desktop often started with a mobile visit. Without a proper attribution model, you undercredit mobile for discovery and overblame it for abandonment. Our guide on marketing attribution explains how GA4 connects these touchpoints without an enterprise budget.
Never manage a single global rate. Always segment by device, and cross-reference with average order value per device. A mobile rate of 1.5% on a small basket can weigh less, in margin, than a desktop rate of 3% on a large one.
6. Return rates and cart abandonment: the forgotten numbers
The average cart abandonment rate is close to 70%, and the return rate reaches up to 24% in fashion in France. These two numbers, rarely cross-referenced with conversion, explain why the reported rate almost always overstates a store's real profitability.
Cart abandonment rate measures the share of buyers who add a product then leave without paying. According to Baymard Institute, the consolidated average across 49 studies reaches 70.19%. In other words, seven carts out of ten never turn into an order. The main causes: surprise shipping costs, mandatory account creation, and a checkout that's too long.
| Indicator | Value | Source |
|---|---|---|
| Average cart abandonment rate | ~70% | Baymard Institute |
| Abandonment linked to unexpected costs | ~48% | Baymard Institute |
| Abandonment linked to mandatory account creation | ~24% | Baymard Institute |
| Fashion return rate, France | ~24% | Fevad / Trusted Shops |
| Return rate, all sectors | ~10% to 15% | Statista |
Return rate is the second forgotten number. According to Trusted Shops and sector data relayed by Fevad, fashion sees up to 24% in returns, against 10% to 15% across all sectors. Every return generates logistics costs, restocking costs, and sometimes disposal costs. A product sold isn't a product kept.
This is where interpretation gets critical. A fashion store reporting a 2.5% conversion rate but facing 24% in returns really converts, in net value kept, the equivalent of about 1.9%. Gross conversion flatters; net conversion tells the truth. Most benchmarks ignore this chain.
According to Speed Commerce and several logistics studies, the cost of processing a return can represent 20% to 65% of the returned product's sale price, depending on category. For low-margin items, a high return rate can turn an apparently profitable sale into a straight loss.
Reducing cart abandonment usually offers the best effort-to-result ratio. Showing shipping costs early, offering guest checkout, and shortening the funnel recover part of the 70% of lost carts. According to Baymard, a serious checkout optimization can improve conversion by an average of 35% on the least optimized sites.
7. The "net conversion rate": real profitability
Net conversion rate connects gross conversion, cart abandonment, and returns to reveal real profitability. A fashion store at 2.5% gross, after 24% in returns, keeps only about 1.9% in net conversion value. This gap is what separates reported performance from actual performance.
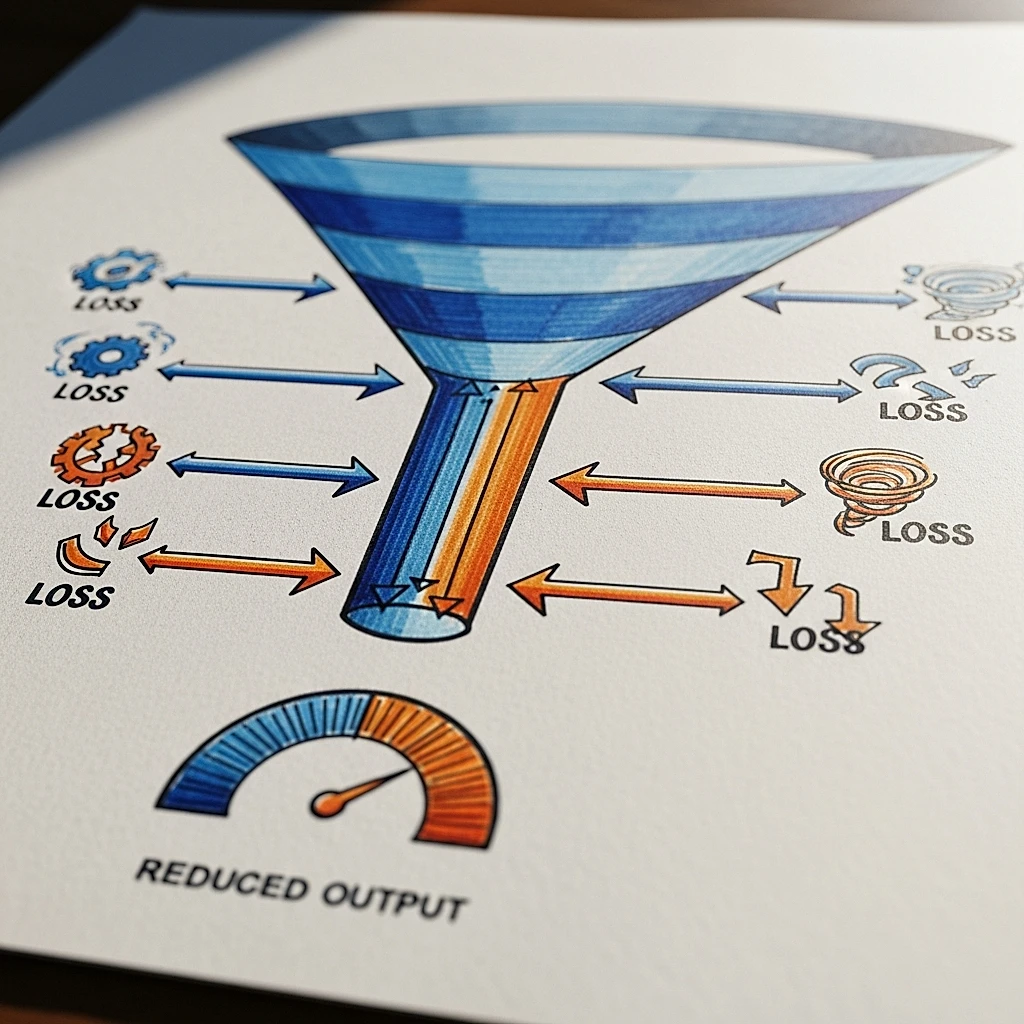
The calculation is simple. Start from the gross conversion rate, then apply the return rate to get the share of sales actually kept. A store with 3% gross conversion and 15% returns keeps 2.55% net conversion. At equal gross conversion, two stores in different sectors don't have the same profitability.
| Scenario | Gross conversion | Return rate | Net conversion |
|---|---|---|---|
| Food | 3% | ~5% | 2.85% |
| Beauty | 2.8% | ~10% | 2.52% |
| Tech | 1.8% | ~12% | 1.58% |
| Fashion | 2.5% | ~24% | 1.90% |
| Furniture | 1.2% | ~8% | 1.10% |
This table, based on sector return ranges relayed by Fevad and Statista, illustrates a point most top-10 Google results miss: the ranking changes when you move from gross to net. Fashion, with a higher gross rate than tech, ends up with comparable net conversion once returns are factored in.
For the business owner, the implication is direct. Optimizing gross conversion without touching returns is like filling a bucket with a hole in it. In fashion, cutting the return rate from 24% to 20% often has more impact on margin than a 0.2-point gain in gross conversion. Precise size guides, accurate photos, and customer reviews are underused levers against returns.
According to Synolia and several French ecommerce integrators, product page quality influences both conversion and return rate at the same time: a clear product page converts better and disappoints less. It's the rare lever that works positively on both ends of the chain. To spot these friction points in your own funnel, our web analytics method describes how to read real visitor behavior.
8. What these statistics mean for a small business
For a small business, gaining 0.6 points of conversion can generate tens of thousands of euros over 90 days. For a realistic store doing 50 orders a day, moving from 1.8% to 2.4% conversion increases revenue by about 33% at constant traffic, without spending an extra euro on acquisition.
Take a concrete micro-case. A store gets 2,800 sessions a day and converts at 1.8%, or about 50 orders daily. With an average order value of €65, its daily revenue reaches €3,250. Over 90 days, that's €292,500.
| Indicator | Before | After |
|---|---|---|
| Conversion rate | 1.8% | 2.4% |
| Orders / day | ~50 | ~67 |
| Revenue / day (€65 order value) | €3,250 | €4,355 |
| Revenue over 90 days | €292,500 | €391,950 |
| Net gain over 90 days | / | ~€99,450 |
The same traffic, better converted, produces nearly €100,000 more over a quarter. This gain requires no increase in ad spend: it comes purely from funnel optimization. That's what makes CRO (Conversion Rate Optimization) more cost-effective than acquisition for most small businesses.
Which levers to pull depends on your current rate. Under 1%, the problem is almost always traffic quality: before optimizing the site, check your acquisition sources. Between 1% and 2%, checkout is suspect number one, with its hidden fees, mandatory accounts, and unnecessary steps. Above 2%, gains come from trust signals, speed, and reducing returns.
The order of priority matters. According to Baymard, checkout offers the best effort-to-result ratio, with a potential +35% conversion gain on poorly optimized sites. Mobile speed comes next, then trust signals: customer reviews, guarantees, displayed delivery times. According to Bpifrance Le Lab, small businesses that structure their data management grow faster than those running on gut feeling.
The reverse risk exists too: chasing conversion rate by slashing prices. A rate that rises because margin is collapsing isn't a win. The right metric stays revenue net of returns and acquisition costs, not the isolated gross rate. Our data-driven business benchmark shows the performance gap between companies that use their data and those that don't.
9. Methodology & sources
This report covers the 2023 to 2026 period, with particular attention to data published on the 2025 ecommerce year and 2026 projections. It draws on more than 20 distinct sources, combining French institutions, analytics platforms, and specialized research institutes.
The aggregation method distinguishes three levels. Macro data (revenue, volumes, average order value) comes from Fevad and Bpifrance, official French sources. Behavioral data (conversion rate, mobile/desktop gap, cart abandonment) comes from Contentsquare, Shopify, Baymard Institute, and Statista. Field observations are explicitly attributed to our team and stay qualitative, with no invented national figures.
We favored qualified ranges over falsely precise single figures. When sources diverge, we give an interval rather than a misleading single point. Sector rates are consolidated medians, not averages, to neutralize the effect of outliers.
Clear distinction: any table row marked "Field observation" reflects our audits, not a representative national statistic. Every other row points to a named, verifiable third-party source. Sources used include Fevad, Contentsquare, Shopify, Baymard Institute, Statista, Bpifrance Big Media, Bpifrance Le Lab, Trusted Shops, Synolia, Speed Commerce, Google Analytics, Google CrUX, Eurostat, INSEE, ACSEL, Médiamétrie, Semrush and Ahrefs.
Last revised: June 14, 2026. We commit to quarterly updates, as Fevad and Contentsquare publish new annual reports and our audits enrich the field observations.
10. Outlook 2026 → 2028
The French ecommerce conversion rate should stay structurally stable around 2% through 2028, but net conversion rate should improve as businesses get better at managing returns and checkout. Revenue growth will keep coming from volume more than from gross conversion.
Three trends will shape the coming years. The first: mobile/desktop convergence. According to Contentsquare, the conversion gap is slowly narrowing as mobile checkouts improve and wallets (one-click payment) become standard. Mobile could sustainably cross 2% in several sectors by 2027.
| Indicator | 2025 | 2028 projection | Source |
|---|---|---|---|
| French ecommerce revenue | ~€200bn | > €240bn | Fevad (projection) |
| Median conversion rate | ~2% | ~2.1% | Contentsquare (projection) |
| Mobile traffic share | > 60% | ~70% | Fevad (projection) |
| Cart abandonment | ~70% | ~65% | Baymard (projection) |
| CRO adoption by small businesses | low | rising | Field observation |
These projections are trend extrapolations, not certainties. They assume the dynamics observed over 2023-2025 continue. A macroeconomic or regulatory shock could shift them.
The second trend: the spread of installment payments and wallets, which reduce checkout friction. According to Fevad, these payment methods are growing fast and pulling mobile conversion up. The third: the arrival of AI shopping assistants, which could reshape the discovery journey and shorten some funnels.
For small businesses, lagging on CRO becomes a concrete opportunity. Most small stores still run on gut feeling, without a sector benchmark or net return tracking. Those that adopt data management gain a measurable edge over competitors, according to converging observations from Bpifrance Le Lab and our own audits.
Centralize your conversion benchmarks with Lysible
Comparing your conversion rate to the right sector median, cross-referencing GA4 with your returns and cart abandonment, and reading a net conversion rate instead of a misleading gross figure: Lysible brings this data together in a single dashboard, with no data expert and no juggling between tools. You see where your store stands against your sector, identify the priority lever based on your current rate, and track the impact of your actions in euros, not just percentages. For a small business owner, that's the difference between noticing and deciding.
Frequently asked questions
What is the average ecommerce conversion rate in France?
The average ecommerce conversion rate in France sits between 1.5% and 3% depending on the sector, with a multi-source median around 2%, according to Contentsquare and Fevad. That means one store in two converts fewer than two visitors out of a hundred into buyers, traffic and sector varying.
What counts as a good ecommerce conversion rate?
A good rate clears 3%, which puts a store in the top quarter of the market according to Contentsquare. The top 20% breaks 3.2% and the top 10% of Shopify merchants reaches nearly 4.7%. Below 1%, the signal points to unqualified traffic or a broken funnel.
What is the average return rate in French ecommerce?
The average return rate reaches 10% to 15% across all sectors, and up to 24% in fashion, according to Fevad and Trusted Shops. Every return costs between 20% and 65% of the product's sale price, which sharply reduces real profitability.
Why does mobile convert worse than desktop?
Mobile converts up to 74% worse than desktop on affected accounts, according to Contentsquare. The causes: complex data entry on a small screen, a browsing-mode usage context, and slower load times. Many purchases start on mobile and finish on desktop, especially at a high order value.
What is the average cart abandonment rate?
The average cart abandonment rate is close to 70%, or 70.19% according to Baymard Institute's consolidated average across 49 studies. The main causes: unexpected costs (48%), mandatory account creation (24%), and a checkout that's too long. Optimizing checkout can improve conversion by 35%.
How does my conversion rate compare to my sector's?
Always compare against your vertical's median, not a global average. Food converts at 2.8% to 3.5%, fashion at 1.8% to 2.5%, furniture under 1.5%. Also check that your calculation base (sessions or unique visitors) matches the benchmark's.
What are the key statistics for ecommerce in France?
French ecommerce came close to €200 billion in 2025, up +9.6% year over year according to Fevad, with more than 2.5 billion transactions and an average order value around €65. France counts more than 200,000 active online stores, according to Bpifrance.
How can you improve your ecommerce conversion rate?
Prioritize based on your current rate: below 1%, fix traffic quality; between 1% and 2%, optimize checkout (Baymard estimates up to +35% gain); above 2%, work on trust signals, speed, and reducing returns. Gaining 0.6 points can generate close to €100,000 over 90 days.

Isaac SIKORSKI
With Lysible, I want to give businesses back control of their online presence. A website you actually understand is one that brings in real opportunities.