Digital Marketing KPIs for Small Businesses: The 10 Worth Tracking
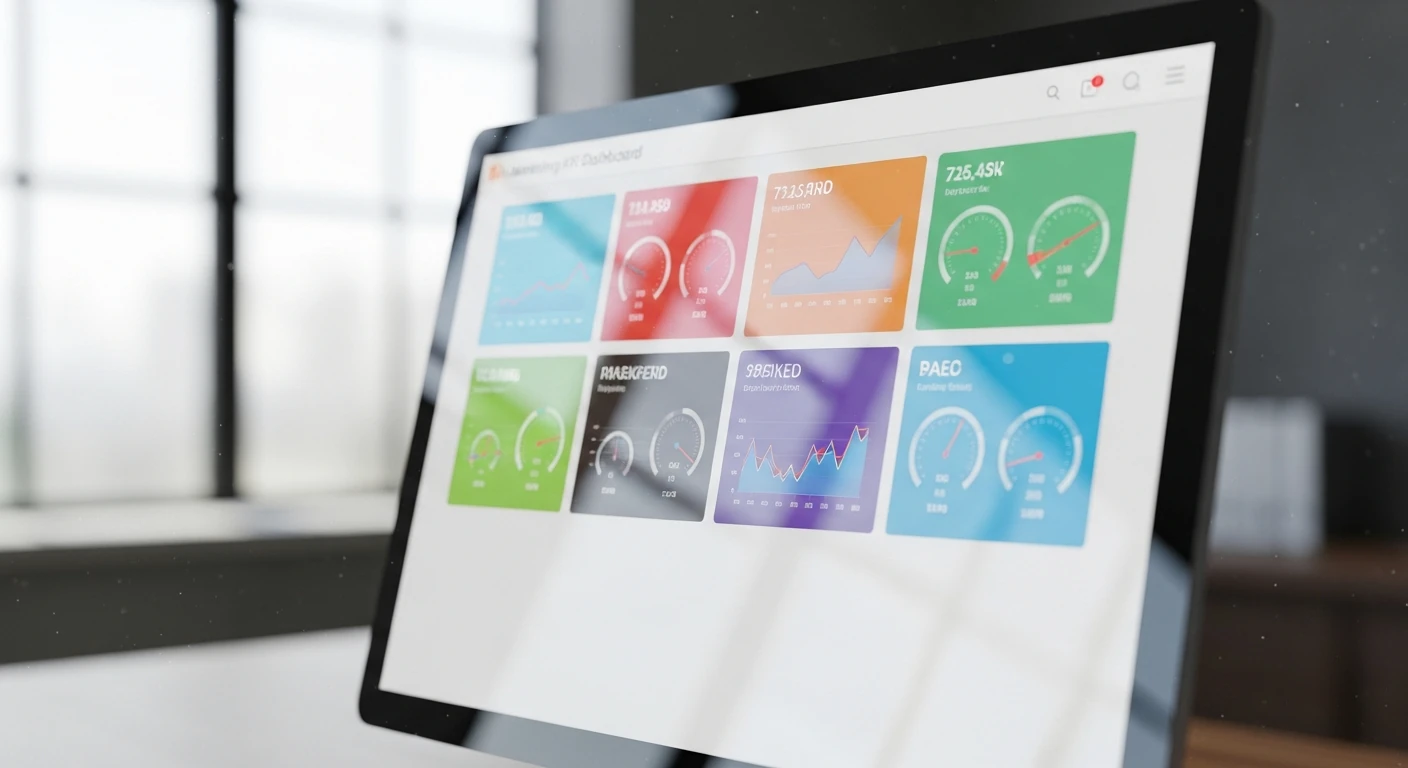
A small business can run its marketing well with 10 indicators, not 36. Five actually matter: qualified traffic, conversion rate, customer acquisition cost (CAC), the LTV/CAC ratio, and ROAS. The reference thresholds: conversion between 1% and 3%, an LTV/CAC ratio aimed at 3:1, and a ROAS floor of 4:1 outside low-margin businesses. Five more round out the picture depending on your business. The rule that changes everything: tie every digital marketing KPI to a concrete decision, and centralize everything in a single dashboard instead of juggling between four tools.
Key takeaways
- A healthy CAC stays below a third of LTV: an LTV/CAC ratio of 3:1 is the profitability threshold small businesses should aim for.
- The median conversion rate for a small business website sits between 1% and 3%; above 3%, the funnel is performing well.
- A ROAS of 4:1 (€4 generated for every €1 spent) is the minimum for a paid campaign to be profitable, outside low-margin businesses.
- Tracking more than 10 KPIs without a data analyst dilutes your attention: 5 to 8 indicators tied to a concrete decision work better.
- 44% of small businesses still run on gut feeling: centralizing KPIs in a single dashboard cuts reporting time by several hours a month.
Table of contents
- How to choose your marketing KPIs without a data analyst
- Qualified traffic, not raw traffic
- Conversion rate, the KPI that reveals your funnel
- Customer acquisition cost (CAC), your real spending limit
- The LTV/CAC ratio, the KPI small businesses forget
- ROAS and advertising return on investment
- Bounce rate, average order value, and purchase frequency
- Attribution and conversion lag: where your customers actually come from
- Recap: the 10 KPIs and their benchmark thresholds by industry
- Centralizing your KPIs in a single dashboard with Lysible
- Frequently asked questions
How to choose your marketing KPIs without a data analyst
The Bpifrance Le Lab barometer on digital transformation among small businesses is fairly clear: a significant share of owners admit to running the business without reliable data. It's a paradox, because most of them have access to more numbers than ever before. The instinct to pile on more metrics only makes the problem worse.
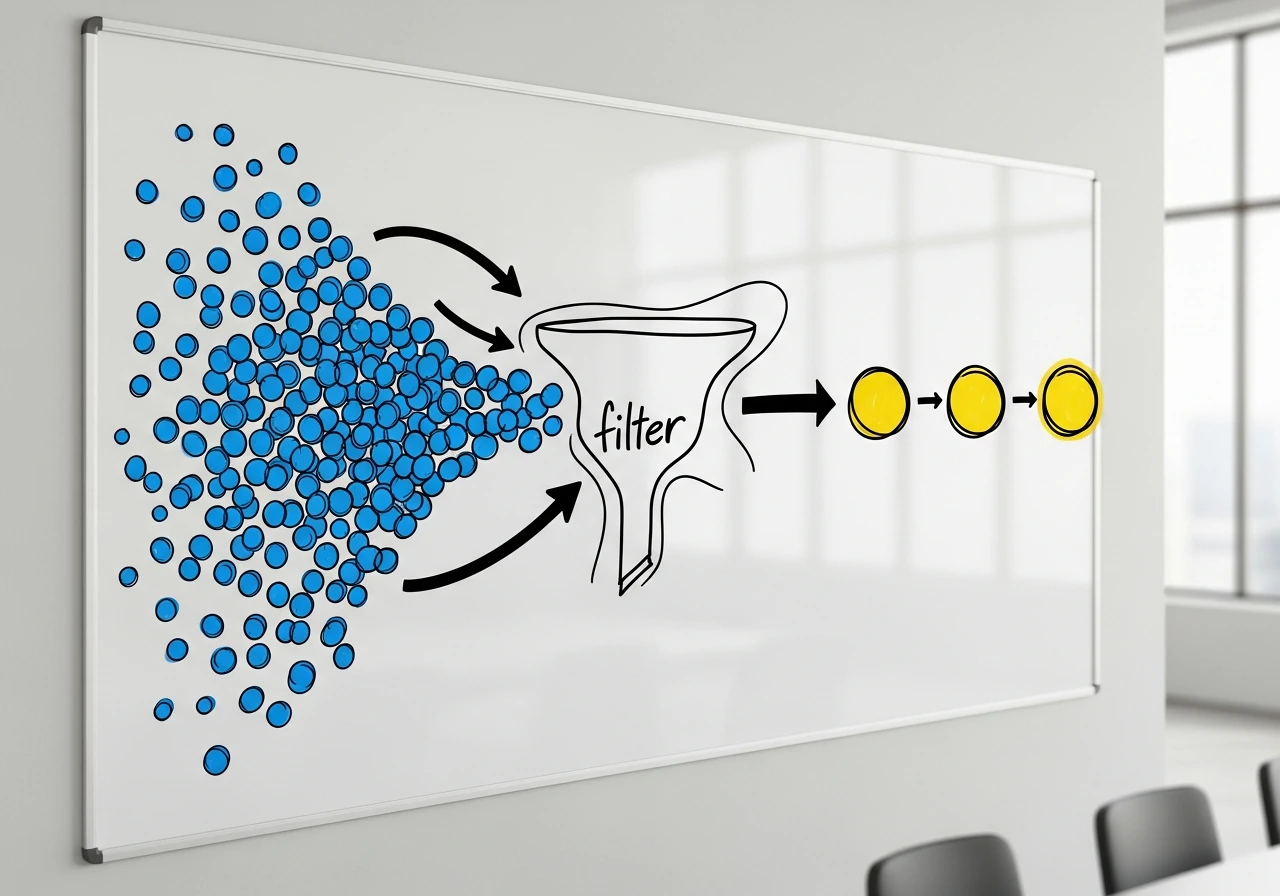
Tracking fewer KPIs, but the right ones, runs a small business better than stacking 30 indicators nobody ever looks at. That's the opposite of what those "36 KPIs you must track" listicles sell you. After going through Google Analytics 4 accounts for several years, I've seen the same pattern repeat: the owner adds indicators out of fear of missing one, the dashboard becomes unreadable, nobody checks it, and decisions still get made by gut feeling anyway.
A performance indicator only has value if it triggers an action. Everything else is clutter.
How many KPIs should a small business actually track?
5 to 8 KPIs are enough, including 5 priority ones each tied to a clear decision. Beyond 10, attention gets diluted and reporting time balloons without any real gain in decision-making.
The brain can't rank 30 signals in parallel. It follows a handful and ignores the rest, often the wrong ones. Among the accounts we work with, owners who stick to 5 KPIs make decisions faster than those tracking 25. Less noise, more signal: that holds true for dashboards as much as anywhere else.
Tying each indicator to a concrete decision
Every KPI you keep should answer a simple question: if this number moves, what do I change? If there's no answer, the indicator comes off the dashboard.
Take conversion rate. If it drops, you touch your funnel or your pages. Clear decision, immediate action. By contrast, "pages viewed per session" almost never triggers anything concrete for a small business owner. Our complete guide to web data analysis breaks down how to cross-reference sources without drowning in them. The rule fits in one sentence: a KPI with no decision attached comes off the dashboard.
Qualified traffic, not raw traffic
5,000 monthly visits can generate zero quote requests if those visitors were looking for something other than what you sell. That's the trap of raw traffic: it flatters the ego and clouds judgment.
Qualified traffic means visitors likely to buy, not sheer click volume. A thousand visits from the curious are worth less than a hundred visits from targeted prospects. The right move is to segment in Google Analytics 4 by channel and intent: branded organic traffic and Search Console traffic on commercial queries convert far better than a viral social spike that misses the target.
On an e-commerce project we tracked last year (a shop with about 12 employees), overall traffic had been flat for three months. By isolating organic traffic on purchase-intent queries in Search Console, we saw it was actually up 20%, while unqualified social traffic was artificially inflating the average. The real growth was invisible in the headline number.
What traffic volume should a small business aim for?
There's no universal threshold: the useful volume depends on your conversion rate and average order value. A small business converting at 2% with a €300 average order doesn't need 50,000 visits to survive.
Work backward. For 20 sales a month at 2% conversion, you need 1,000 qualified visitors, not just 1,000 visitors. Aim for source quality before volume. Our Google Analytics analysis method for GA4 sets the right benchmarks for digging into where your visitors come from and how they perform.
Conversion rate, the KPI that reveals your funnel
A rate between 1% and 3% is the norm for a small business website. It's also the KPI that, better than any other, reveals where your funnel is losing customers.
A low rate with lots of traffic points to a page or targeting problem. A high rate with little traffic signals a healthy funnel that just needs more fuel. This KPI tells you exactly where to invest: fix the site, or buy more traffic. The classic trap? Confusing your overall conversion rate with the rate per channel. A visitor from a Google Ads campaign doesn't convert like an organic visitor. Always segment.
What conversion rate counts as good for a small business?
Above 3%, your funnel is performing well. Below 1%, there's a serious blocker to fix before chasing more traffic. Thresholds vary significantly by industry:
| Small business sector | Median conversion rate | Reading |
|---|---|---|
| General e-commerce | 1.5% to 2.5% | Market norm |
| B2B services (quotes) | 2% to 5% | Long cycle, warm lead |
| Local trades / artisans | 3% to 6% | Strong local intent |
| SaaS (free trial) | 2% to 4% | Depends on onboarding |
| Local retail (in-store visits) | Hard to track | Track calls and directions requests |
If your rate falls below these ranges, don't chase more traffic. Fix the leak first. A website audit focused on conversion blockers can often pinpoint what's dragging down your funnel in just a few hours.
Customer acquisition cost (CAC), your real spending limit
CAC is the total amount spent on marketing divided by the number of customers won over the same period. Think of it as your profitable spending ceiling.

The math is simple: €2,000 spent on ads and content in a month for 40 customers gives you a CAC of €50. Except many owners forget to include the cost of tools and time spent. Fully-loaded CAC is always higher than your Google Ads budget alone.
Here's a real example from a recent engagement. A services business was billing away without knowing its CAC. The math: €4,000 in monthly spend (ads, content, tools) for 25 customers, or a €160 CAC. But their average customer only brought in €220 over their lifetime. Margin was evaporating. By cutting the least profitable campaign and doubling down on organic, CAC fell to €95 within two months. Same number of customers, margin restored.
CAC only makes sense next to what a customer brings in over time. That's exactly the role of the next KPI.
Lysible calculates this LTV/CAC ratio automatically from your sales and acquisition data, with no spreadsheet to update every month.
The LTV/CAC ratio, the KPI small businesses forget
The LTV/CAC ratio is probably the most structuring KPI on this list, and the one most often missing from small business dashboards. It compares what a customer brings in over their lifetime against what it costs to acquire them.
LTV is the sum of the margins a customer generates from their first purchase to their last. If a customer buys an average of 4 times at €80 margin each, their LTV is €320. Divide that by CAC to know if your acquisition is viable. A ratio below 1 means you're losing money on every sale. Most small businesses run their acquisition without ever calculating this ratio, because it means cross-referencing CRM and accounting data, and nobody owns that job.
Why aim for a 3:1 LTV/CAC ratio?
A 3:1 ratio means a customer brings in three times what it costs to acquire them. It's the healthy-profitability threshold recognized across the SaaS and e-commerce world.
Below 3:1, margin is too thin to fund growth and fixed costs. Above 5:1, you're probably under-investing in acquisition: you could win more customers without hurting profitability. It's a bit like rent: paying three times less than what you bring in leaves room to live and reinvest. Calculate this ratio once a quarter, not every day.
ROAS and advertising return on investment
A ROAS of 4:1 means €4 collected for every €1 invested in advertising. This ratio judges the efficiency of your paid campaigns, not your overall profitability, a nuance many advertisers miss.
A 4:1 ROAS on products with a 70% margin is comfortable. The same ROAS on products with a 15% margin loses you money. ROAS should always be read alongside your margin. That's where a lot of advertisers get burned: they optimize the ratio without looking at absolute profit.
What's the minimum ROAS for a profitable ad campaign?
Your ROAS floor depends on your margin. For a comfortable margin, 4:1 is enough. For a thin margin, you need to aim for 6:1 or higher to avoid selling at a loss.
| Gross margin | Break-even ROAS floor |
|---|---|
| 60% and above | 2:1 to 3:1 |
| 40% to 60% | 3:1 to 4:1 |
| 20% to 40% | 4:1 to 5:1 |
| Under 20% | 6:1 and above |
Google Ads' documentation on measuring return on investment makes a point that's often overlooked: a high ROAS on low volume isn't worth as much as a moderate ROAS on high, profitable volume. Look at absolute profit, not just the ratio.
Bounce rate, average order value, and purchase frequency
These three secondary KPIs sharpen the picture without overloading a non-technical owner. Look at them only after you've mastered the first five, never before.
Bounce rate shows the percentage of visitors who leave without interacting. Watch out for one trap: in Google Analytics 4, the reference metric is now engagement rate (the inverse of bounce). A high bounce rate isn't always bad. On an hours-and-contact page, the visitor finds the info and leaves satisfied. This metric matters most on product pages and campaign landing pages.
Average order value and purchase frequency feed directly into the LTV calculation. Raising average order value by 10% through product recommendations often has more impact on margin than gaining 10% more traffic. In practice, tools like Hotjar help you understand why a visitor isn't adding to cart, by showing their actual journey on the page. This kind of behavioral data usefully complements GA4 tracking, especially when the numbers drop for no obvious reason.
| Secondary KPI | Tracking tool | Action if it drops |
|---|---|---|
| Engagement / bounce rate | Google Analytics 4 | Review page content and speed |
| Average order value | GA4 e-commerce, CRM | Cross-sell, free-shipping threshold |
| Purchase frequency | CRM, HubSpot | Follow-up, loyalty programs, email |
These indicators are optimization levers, not daily alarms. A monthly glance is plenty.
Attribution and conversion lag: where your customers actually come from
The default attribution model, "last click," almost always misleads small businesses. It overvalues end-of-journey channels and makes the ones that sparked everything invisible.
Imagine a customer who discovers your brand through an ad, comes back a week later via a Google search, then buys after a follow-up email. Last click attributes 100% of the sale to the email. The ad gets zero credit. The result: many owners cut their most useful campaigns simply because the model renders them invisible on the dashboard.
Conversion lag is the time elapsed between a first visit and a purchase. In B2B, this lag often runs several weeks. Measuring it keeps you from judging a campaign too early and cutting it while it's still working. In early 2025, a small business client told me he'd stopped his display campaigns after two weeks "because they weren't converting." His average conversion lag was 19 days.
How do you know which marketing channel drives the most sales?
Cross-reference Google Analytics 4's conversion paths with your CRM data. GA4 shows the sequence of channels a visitor went through; your CRM confirms the actual sale and its amount.
The conversion paths report in GA4 reveals the channels that come into play at the start and middle of the journey, not just at the end. Google's official recommendations on attribution models explain why the data-driven approach beats last click. Never judge a channel on its final conversion alone: a channel that kicks off a lot of journeys is often worth more than the one that closes them. Our approach to automated SEO audits shows how to connect these sources without a manual spreadsheet.
Recap: the 10 KPIs and their benchmark thresholds by industry
Here's the summary of all 10 KPIs, ranked by priority for a small business without a data analyst. Track the first five every month; the next five quarterly, or as your business calls for.

| KPI | Reference threshold | Priority | Decision triggered |
|---|---|---|---|
| Qualified traffic | Depends on sales target | High | Adjust sources and targeting |
| Conversion rate | 1% to 3% (3%+ = good) | High | Fix funnel or pages |
| CAC | Below 1/3 of LTV | High | Cut unprofitable channels |
| LTV/CAC ratio | 3:1 minimum | High | Invest more or scale back acquisition |
| ROAS | 4:1 outside low-margin businesses | High | Allocate ad budget |
| Average order value | Should be growing | Medium | Cross-sell, shipping threshold |
| Purchase frequency | Depends on industry | Medium | Loyalty, follow-up |
| Engagement rate | Compare by page | Medium | Review content and speed |
| Attribution | Multi-touch > last click | Medium | Reallocate channel budget |
| Conversion lag | Depends on sales cycle | Low | Calibrate budget patience |
The prioritization logic follows an impact/effort matrix calibrated for small organizations. A KPI with high impact and low tracking effort ranks first. Conversion lag, useful but costly to track properly, stays at the bottom of the list for most small businesses.
This hierarchy avoids the most common mistake, documented in our barometer on data-driven businesses: trying to track everything, and ending up steering nothing. According to Insee data on the French small business landscape, the vast majority of French companies are structures with fewer than 10 employees and no dedicated marketing team. For them, 5 well-tracked KPIs beat 30 ignored ones, as also confirmed by the Arcep digital barometer.
Centralizing your KPIs in a single dashboard with Lysible
The real bottleneck isn't calculating the KPIs. It's the monthly chore of juggling Google Analytics 4, Search Console, Google Ads, and a spreadsheet to rebuild an overview that should have existed from day one.
For an e-commerce small business with 15 employees we worked with a few months ago, this reporting went from 6 hours to 30 minutes a month once the sources were connected in one place. Lysible centralizes your acquisition, conversion, and profitability data in one place, analyzed and connected automatically, with no data analyst and no juggling between tools. You see what's happening, and you decide with full information.
Do you need a tool to track marketing KPIs in a small business?
A tool isn't mandatory to get started, but it quickly pays for itself. Past 3 data sources, manual spreadsheet tracking costs several hours a month and multiplies copy-paste errors. A centralized dashboard makes your numbers reliable and frees up time to decide.
Frequently asked questions
What are the key KPIs to set up in a small business?
Five priority KPIs cover the essentials: qualified traffic, conversion rate, customer acquisition cost (CAC), the LTV/CAC ratio, and ROAS. Together they measure the whole chain, from attracting a visitor through to actual profitability. Five secondary KPIs round things out depending on your business: average order value, purchase frequency, engagement rate, attribution, and conversion lag. What matters isn't the count but the link to a decision. An indicator that triggers no concrete action just clutters the dashboard without helping you steer.
How many marketing KPIs should a small business track?
Between 5 and 8 KPIs are enough to run a small business, with 5 priority ones tied to a clear decision. Past 10 indicators, attention gets diluted and reporting time climbs without any gain in decision-making. Lists of 30 to 36 KPIs suit dedicated data teams, not an owner who's also handling production and sales. Better to track 5 numbers every month and act on them than display 25 you glance at once a quarter and never act on.
What conversion rate counts as good for a small business?
A rate between 1% and 3% is within the norm. Above 3%, your funnel is performing well. Below 1%, a serious blocker deserves fixing before you buy more traffic. Thresholds vary by industry: 1.5% to 2.5% in general e-commerce, 2% to 5% in B2B services, up to 6% for local trades with strong intent. Always segment by channel: a visitor from a paid campaign doesn't convert like an organic visitor, and the overall average hides those gaps.
How do you calculate customer acquisition cost (CAC)?
Divide your total marketing spend over a period by the number of customers won in that same period. Example: €2,000 spent for 40 customers gives you a CAC of €50. Include everything: ad budget, content costs, tool subscriptions, and time spent. Fully-loaded CAC always exceeds your Google Ads budget alone. Then compare that CAC to customer lifetime value: a CAC above a third of LTV signals acquisition that's too expensive and is eating into your margin.
What's the minimum ROAS for a profitable ad campaign?
Your ROAS floor depends on your gross margin. With a margin of 60% or higher, a ROAS of 2:1 to 3:1 stays profitable. With a margin of 20% to 40%, aim for 4:1 to 5:1. Under 20% margin, you need 6:1 or higher to avoid selling at a loss. A 4:1 ROAS works as a general benchmark outside low-margin businesses. Always read this ratio alongside your margin, and look at absolute profit: a high ROAS on small volume is worth less than a moderate ROAS on large, profitable volume.
How do you know which marketing channel drives the most sales?
Cross-reference Google Analytics 4's conversion paths with your CRM data. GA4 shows the sequence of channels a visitor went through; your CRM confirms the actual sale and its amount. Avoid the last-click attribution model, which overvalues end-of-journey channels and hides the ones that sparked interest. A channel that kicks off a lot of journeys often deserves more credit than the one that closes them. Judge every channel on the whole journey, never on its final conversion alone.
Do you need a tool to track marketing KPIs in a small business?
Not mandatory when starting out, but it pays off as soon as you're cross-referencing more than three data sources. Manual spreadsheet tracking costs several hours a month and multiplies copy errors across Google Analytics 4, Search Console, and Google Ads. A centralized dashboard makes your numbers reliable, automates CAC and ROAS calculations, and frees up time to decide rather than compile. The payoff shows up fast: for the businesses we work with, monthly reporting often drops from several hours to under half an hour.

Isaac SIKORSKI
With Lysible, I want to give businesses back control of their online presence. A website you actually understand is one that brings in real opportunities.