Ecommerce Conversion Funnel: 2026 Guide
A high-performing ecommerce conversion funnel converts above 3% overall, with a cart abandonment rate under 70% and a checkout abandonment rate under 25%. Most of the losses happen between adding to cart and completing payment, stages that GA4 can map in under an hour using the Funnel Exploration report. The method comes down to four steps: measure each stage, identify the priority leak point, translate the loss into euros, and fix the biggest lever first. This guide gives you the thresholds, the tools, and the concrete actions.

Table of contents
- Where is your store really losing customers in 2026?
- The 4 key stages of the ecommerce conversion funnel
- Setting up GA4 to track your ecommerce funnel step by step
- The 6 KPIs to check every week for your funnel
- 5 concrete levers to reduce drop-off at every stage
- Common mistakes dragging down your conversion rate in 2026
- Analyzing your conversion funnel with Lysible
- Frequently asked questions
Where is your store really losing customers in 2026?
The average cart abandonment rate is still massive. According to data compiled by the Baymard Institute on cart abandonment, it sits around 70.19% globally. In other words: out of 100 visitors who add a product to their cart, 70 leave without paying. For a store generating €50,000 in monthly revenue, that works out to roughly €115,000 in potential revenue lost every month, at a constant average order value. A brutal number.
When I work with an ecommerce SMB, the first signal I look at is the cart-to-payment ratio. Not traffic. Not search rankings. The cart-to-payment ratio. Because that's where the money leaks out without anyone noticing.
The 3 most common leak points on an ecommerce site
Across the accounts audited over the past two years, three areas account for most of the losses.
The product page first: one visitor in two leaves without adding to cart, often due to a lack of reassurance (reviews, delivery times, shipping costs). The cart next, where surprise shipping fees cause 48% of carts to be dropped, according to the Baymard Institute. The checkout last, with forms that are too long, forced account creation, and limited payment options.
Last year, on a 12-person ecommerce project in the home decor sector, we found that 61% of the abandonment happened right at the shipping cost step, revealed too late in the journey. The upshot: before raising the Google Ads budget, those three holes had to be patched first. Otherwise, you're filling a leaking bucket.
Industry benchmarks: conversion rates by stage in 2026
Raw numbers mean nothing without an industry reference point. Here are the ranges I see across French accounts in 2026, cross-checked against FEVAD's publications on the French ecommerce market and Baymard's benchmarks.
| Industry | Overall conversion rate | Add-to-cart rate | Checkout abandonment |
|---|---|---|---|
| Fashion & accessories | 1.8-2.5% | 8-11% | 22-28% |
| Beauty & cosmetics | 2.5-3.8% | 10-14% | 18-24% |
| Home & decor | 1.5-2.2% | 6-9% | 25-32% |
| Electronics & tech | 1.2-1.9% | 5-8% | 28-35% |
| Food & grocery | 3.5-5.2% | 14-20% | 15-20% |
If your fashion store is stuck at 1.1%, the problem isn't the market. It's your funnel. One extra conversion point on a site with 80,000 monthly visitors works out to roughly 800 additional orders a month, which changes the profitability equation dramatically.
The 4 key stages of the ecommerce conversion funnel
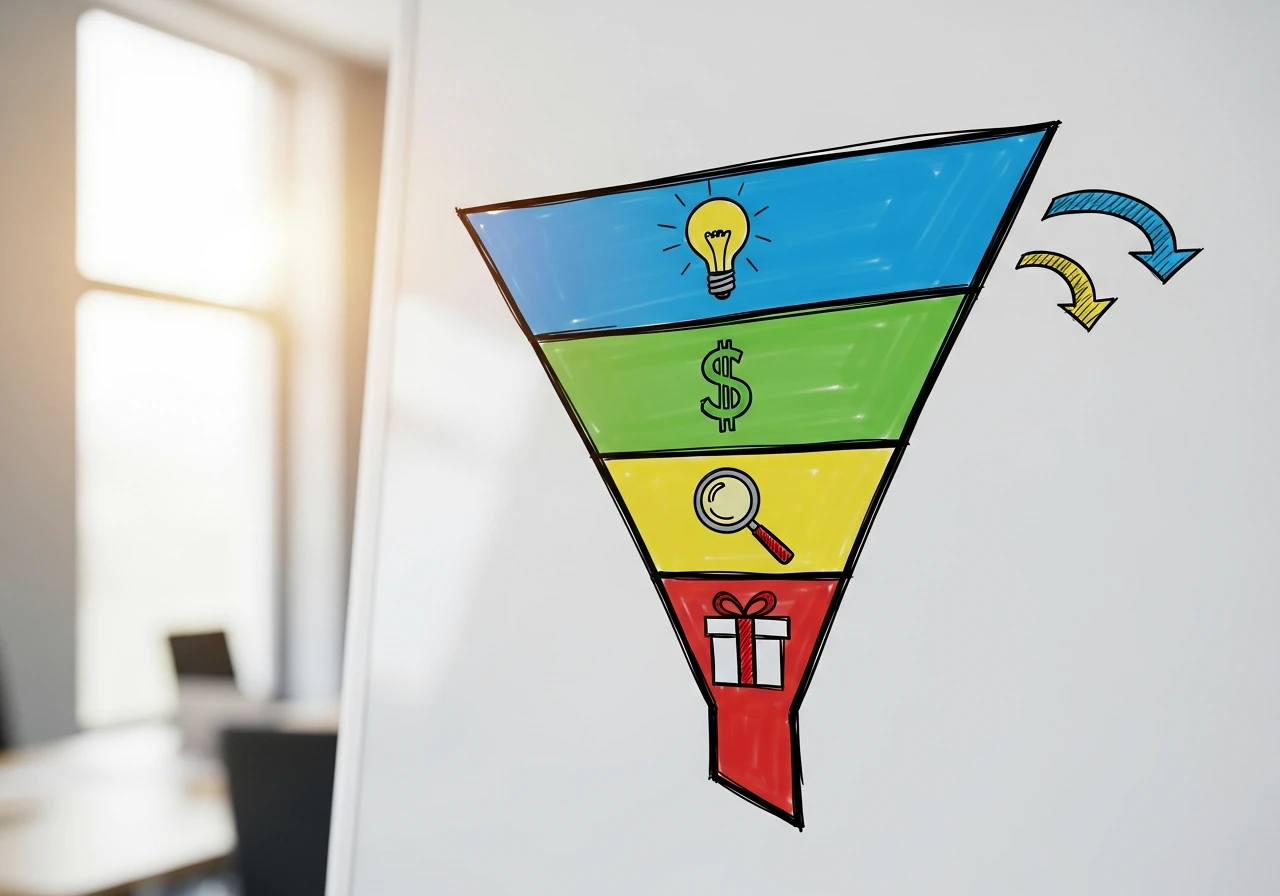
Forget the theoretical models. An ecommerce funnel you can actually manage comes down to four measurable stages, each tied to a specific GA4 metric and an alert threshold. To dig deeper into the overall method for reading web data, see also our expert guide to web data analysis.
1. Acquisition: attracting the right traffic
Acquisition covers every channel through which a visitor lands on your site: SEO, Google Ads, social media, email, direct. The KPI to track isn't raw volume, it's the conversion rate by channel. A channel bringing in 10,000 visitors at 0.3% conversion is less profitable than one bringing in 1,500 at 4%.
Alert threshold: a channel under 0.8% conversion over 30 days deserves an immediate diagnosis. You no longer judge a source by its volume, but by the orders it actually generates.
2. Engagement: turning visitors into potential buyers
Engagement is measured by the ratio of sessions with a product view to total sessions, and the ratio of add-to-carts to product views. A site with fewer than 30% product views has a navigation or categorization problem. A site where fewer than 6% of product views lead to an add-to-cart has a product page problem.
In practice, I often see stores investing heavily in advertising without first checking that their product pages convert. The result: they pay for traffic that just bounces.
3. Conversion: closing the sale without friction
This is the most profitable link to optimize. Between add-to-cart and completed payment, you lose 65 to 75% of users on average. The key KPI: checkout conversion rate (begin_checkout to purchase). A healthy threshold sits above 35%. Below 25%, you have a massive leak, almost always tied to shipping costs or an overly complex form.
4. Retention: maximizing customer value after purchase
Retention is the cheapest lever, and the most overlooked one. A customer buying a second time costs on average five times less to activate than a new customer (a consistent figure found across most McKinsey retail studies). The KPI: 90-day repeat purchase rate. Healthy target: 20 to 30%, depending on the industry.
In practice, a post-purchase email follow-up program can multiply an SMB's profitability without adding a single euro to the acquisition budget.
Setting up GA4 to track your ecommerce funnel step by step
Without a properly configured GA4, you're flying blind. Here's the method applied to every client account.
Turning on the Funnel Exploration report in GA4
In GA4, go to Explore (the magnifying glass icon on the left), then click Funnel exploration. You land on a blank template where you define each step yourself. It's the most powerful tool GA4 has for reading the funnel, and the most overlooked by small businesses.
Recommended steps to set up, in order: view_item (product view), add_to_cart (add to cart), begin_checkout (checkout started), add_payment_info (payment info entered), purchase (order completed). With five steps, you get a complete map of your funnel and the drop-off percentage at every transition.
The GA4 ecommerce events to set up first
GA4 uses standard event names documented on the official GA4 ecommerce events page. The five that actually matter:
| Event | Funnel stage | Essential? |
|---|---|---|
| view_item | Product page viewed | Yes |
| addtocart | Added to cart | Yes |
| begin_checkout | Checkout started | Yes (critical) |
| addpaymentinfo | Payment info entered | Recommended |
| purchase | Order completed | Yes |
Across the accounts audited, not configuring begin_checkout is the number one cause of blind spots. Without this event, you'll never know how many people enter checkout and how many leave without paying. It's the most valuable step to measure. Why? Because that's exactly where the decision tips one way or the other.
Reading and interpreting your funnel data in 10 minutes
Once the Funnel report is set up, the weekly reading routine takes ten minutes. First, look at the drop-off rate between each step (the "Abandonment" column in the report). Spot the transition where you lose the most points: that's your priority for the week.
Recently, I saw a dashboard where three teams had been arguing about the home page for a month, while the Funnel report clearly showed 68% drop-off between begin_checkout and add_payment_info. One screen, one priority. To go further on reading GA4 reports in detail, see our full guide to Google Analytics.
The 6 KPIs to check every week for your funnel
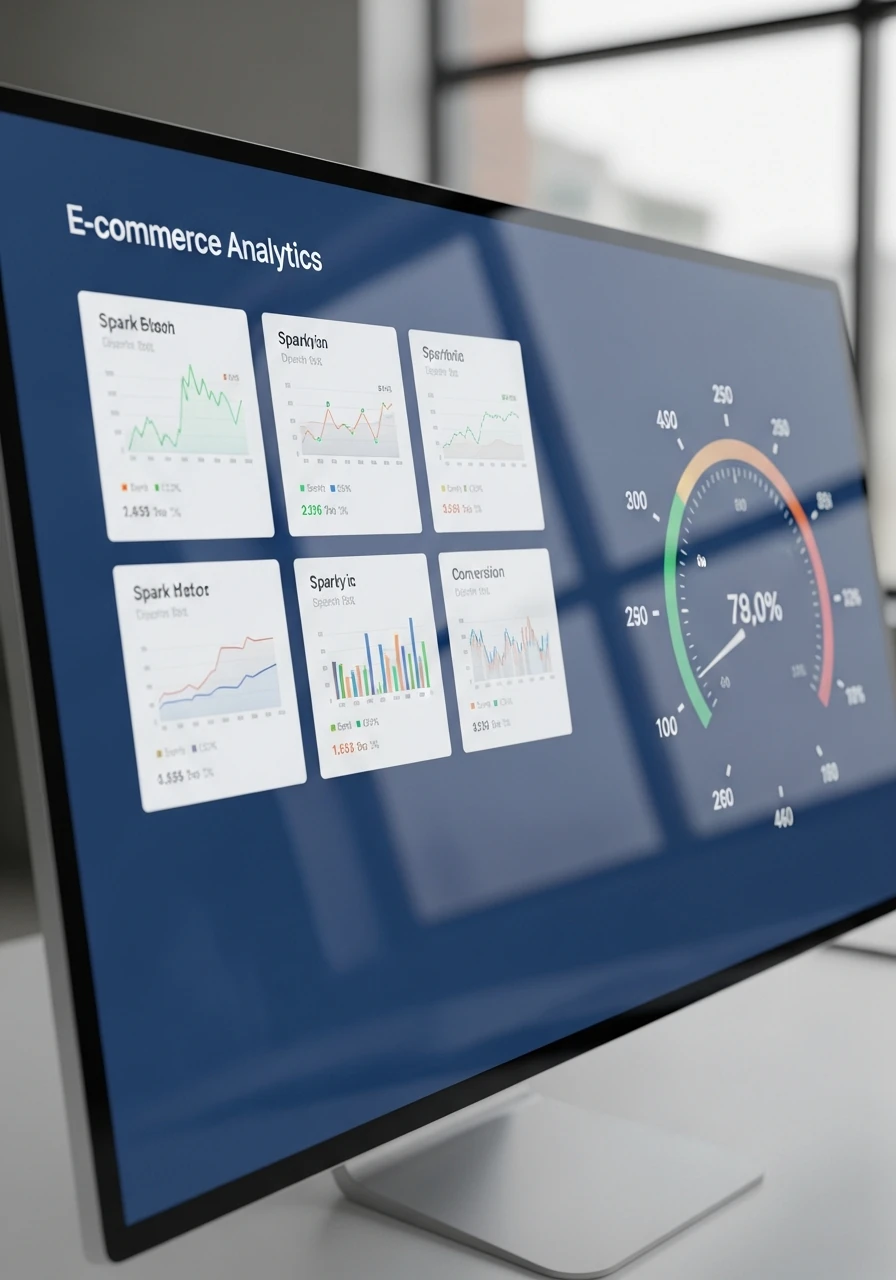
Not twenty KPIs. Six. Read every Monday morning, in ten minutes. That's what separates stores that improve from the ones that don't.
Overall conversion rate and rate by acquisition channel
The overall conversion rate is the macro snapshot. The rate by channel is the useful picture. GA4 segments it natively under Reports > Acquisition > Traffic acquisition. Compare each source to your average: a source 30% below average signals either poor targeting or a landing page that doesn't fit.
Cart abandonment rate and checkout abandonment rate
Tell them apart carefully. Cart abandonment (visitors who add to cart without entering checkout) signals a motivation problem: price, fees, doubts. Checkout abandonment (enter checkout without completing) signals a friction problem: form, payment, technical bug. The fixes aren't the same.
Average order value (AOV) and customer LTV
AOV (average order value) is calculated simply: revenue divided by number of orders. LTV (customer lifetime value) factors in purchase frequency over 12 or 24 months. A store with a €45 AOV and 1.8 average purchases per customer generates €81 in 12-month LTV. This figure determines how much you can spend on acquisition, and it's where many small businesses get their benchmark wrong.
| KPI | Formula | 2026 benchmark | Tracking frequency |
|---|---|---|---|
| Overall conversion rate | Orders / sessions | 1.8-3.2% | Weekly |
| Cart abandonment rate | 1 - (begincheckout / addto_cart) | < 70% | Weekly |
| Checkout abandonment rate | 1 - (purchase / begin_checkout) | < 25% | Weekly |
| AOV (average order value) | Revenue / number of orders | Varies by industry | Weekly |
| 90-day repeat purchase rate | Returning customers / total customers | 20-30% | Monthly |
| Mobile vs desktop conversion | Mobile CR / desktop CR | > 50% | Monthly |
This table pinned next to your screen is worth more than ten complex dashboards. No unnecessary sophistication: just six numbers, read regularly.
Lysible shows exactly these six numbers on a single screen, updated automatically from GA4, without rebuilding this table every week.
5 concrete levers to reduce drop-off at every stage
Five actions, each with an expected measurable gain. The order isn't arbitrary: start with the one that addresses your biggest leak point identified in the Funnel report.

Optimizing the product page to increase add-to-cart
Three elements account for 80% of the gap between a product page that converts and one that bounces: photos (at least 6, including one showing the product in use), customer reviews visible above the fold, and a clear indication of delivery times. Adding verified reviews to a page that had none increases the add-to-cart rate by 15 to 25% on average, across the accounts we support.
Reducing checkout friction (shipping, payment, form)
The Baymard Institute identifies surprise shipping fees as the number one cause of checkout abandonment (48% of cases). Concrete fixes: show fees right from the cart, offer a free-shipping threshold (€50 is a common sweet spot), and offer at least three payment methods, including one split-payment option.
Cutting a checkout form from 12 to 6 fields increases checkout conversion by 8 to 12% on average. Guest checkout (no mandatory account creation) adds another 4 to 7 points.
Recovering abandoned carts with email and retargeting
A sequence of three emails (H+1, D+1, D+3) typically recovers 10 to 15% of abandoned carts. Proportionally, it's the most profitable lever in the funnel: it turns dead losses into revenue, at close to zero marginal cost. In early 2026, one small-business client told me they'd recovered over €3,000 in a single month from this sequence alone, without changing a single line of their site.
Improving load speed: a direct impact on conversion
According to data published by Think with Google on mobile speed, every extra second of load time cuts mobile conversion by 12 to 20%. Target: LCP (the time before the main content area displays) under 2.5 seconds. Measure it with Lighthouse or PageSpeed Insights. To dig into this mechanic, our step-by-step guide to website audits covers the method.
Testing with A/B testing: where to start?
A/B testing is only useful on high-traffic pages (a minimum of 1,000 sessions a week on the page being tested). Start with checkout, then the product page. Avoid testing the home page: too many goals overlap there, and a poorly framed test produces falsely positive results that can lead you into bad decisions for weeks.
Common mistakes dragging down your conversion rate in 2026
After five years analyzing GA4 accounts, I've learned that the same mistakes keep coming back. Three in particular.
Mistake 1: not separating mobile traffic from desktop traffic
The average mobile conversion rate sits between 1.5 and 2%. Desktop sits between 3 and 4%. Without segmenting by device, your overall average hides two opposite realities. A store where 70% of traffic is mobile but 60% of sales come from desktop has a mobile UX problem, not a global one.
Action: build two comparisons in GA4 (Device = mobile vs. Device = desktop) and read all your KPIs side by side. Five minutes. It changes the whole picture.
Mistake 2: confusing bounce rate with abandonment rate
Bounce rate measures sessions where the user left without interacting. Abandonment rate measures users who started a process (cart, checkout) without finishing it. These are not the same signal at all. Optimizing bounce with checkout-focused actions is about as effective as fixing a leaking tap by repainting the wall.
Mistake 3: optimizing without segmenting by channel or device
A change that improves desktop conversion can hurt mobile conversion. Every optimization has to be tracked by segment. The full methodology is covered in our guide to automated SEO audits, which includes the segmentation mechanics specific to GA4.
Stop making decisions based on misleading averages. Start making decisions based on consistent segments.
Analyzing your conversion funnel with Lysible
Reading your conversion funnel today means pulling together GA4, Search Console, Lighthouse, and sometimes Tag Manager. That's exactly what Lysible centralizes: a unified view of the ecommerce funnel, with industry thresholds built in and losses translated directly into euros. For a small business, this means identifying the priority leak point in a few minutes, without juggling five interfaces. The concrete benefit: taking back control of profitability before increasing the acquisition budget. Companies that manage their data this way get measurable results, as detailed in our 2026 data-driven companies report.
Frequently asked questions
What's a good ecommerce conversion rate in 2026?
A good overall ecommerce conversion rate sits between 2% and 3.5%, depending on the industry, as of May 2026. Fashion and home decor range between 1.8% and 2.5%. Beauty climbs to between 2.5% and 3.8%. Food and grocery reaches up to 5%. Below 1.5%, you have a clear funnel or traffic quality problem. Above 4%, in a standard industry, you're excellent. These averages need to be read by device: mobile stays structurally around 1.5-2%, desktop around 3-4%.
What are the 4 key stages of a conversion funnel?
Acquisition, engagement, conversion, retention. Acquisition brings in traffic through SEO, ads, and social. Engagement turns the visitor into a qualified prospect (product view, add to cart). Conversion closes the sale at checkout. Retention maximizes customer value after the first order through repeat purchases. Each stage is measured in GA4 with a standard event (viewitem, addto_cart, purchase) and a dedicated KPI. The funnel isn't strictly linear in reality, but this four-stage structure remains the most practical framework for a small business.
How do you measure cart abandonment with GA4?
In GA4, go to Explore, then Funnel exploration. Create a new funnel with the steps addtocart, begincheckout, purchase. The report automatically shows the drop-off rate between each step. Cart abandonment rate is calculated as: 1 - (begincheckout / addtocart). Above 70%, you're at the global average. Above 80%, that's a critical signal. For this calculation to work, the standard ecommerce events need to be correctly configured through Tag Manager or directly in your CMS (PrestaShop, Shopify).
Conversion funnel vs. marketing funnel: what's the difference?
The marketing funnel describes the prospect's full journey, from first exposure to the brand through to retention (the TOFU/MOFU/BOFU model). The ecommerce conversion funnel focuses on the measurable, transactional part of that journey on your site: from the first visit to the completed order. The funnel is a broad marketing concept. The conversion funnel is a precise analytical object, measured in GA4. In practice, the conversion funnel is the subset of the funnel that a small business owner has direct, immediate control over.
How long does it take to see the effects of an optimization?
On checkout, effects show up in 7 to 14 days, provided you have at least 500 checkout sessions a week. On the product page, allow 14 to 30 days for the measurement to stabilize. On acquisition (SEO in particular), effects take 2 to 4 months. Avoid drawing conclusions from fewer than 100 conversions after a change: statistical variability will mislead you. My rule of thumb: measure two full weeks against two full weeks before the change, never on partial weeks.
Do you need a paid tool to analyze your conversion funnel?
No, not necessarily. GA4 is free and enough for a solid read of the funnel if the events are properly configured. You can add Search Console (free), Lighthouse (free), and the free version of Hotjar for heatmaps. Paid tools like Matomo or centralized SaaS platforms become worth it once you want to save reading time, automatically cross-reference multiple data sources, or translate the numbers into euros. The real question isn't the cost of the tool, it's the cost of the time you spend reading scattered data.
How do you reduce the checkout abandonment rate?
Three high-impact actions. One, show shipping fees right from the cart (the number one cause of abandonment, according to Baymard). Two, offer guest checkout with no mandatory account creation. Three, cut the form down to 6 fields maximum, with address auto-completion. Combined, these three actions reduce checkout abandonment by 15 to 25% in most cases. Add a split-payment option (Klarna, Alma) if your average order value is above €80, that's a net gain of another 4 to 8 points.
What tools should a small business use to analyze its conversion funnel?
The basic combo, free and enough to get started: Google Analytics 4 for the funnel, Google Search Console for SEO acquisition, Google Tag Manager for event setup, Lighthouse for technical performance, Hotjar (free version) for heatmaps. If you're handling more than 30,000 monthly sessions, or want to automate cross-source reading, centralized SaaS solutions can save you several hours a week. Avoid overly technical tools built for data analysts: what you need is to decide, not to manipulate data.

Isaac SIKORSKI
With Lysible, I want to give businesses back control of their online presence. A website you actually understand is one that brings in real opportunities.