Core Web Vitals: LCP, INP, CLS Optimization Guide 2026
Optimizing Core Web Vitals comes down to 5 operational steps you can run without a dedicated tech team. Measure LCP, INP, and CLS through Search Console and Lighthouse, cross-referencing field data with lab data. Fix LCP first (WebP hero image, TTFB, preload), since it accounts for 70% of failures on small business sites. Then lighten INP by removing unused third-party scripts. Stabilize CLS by reserving space for images and banners. Track results monthly to catch regressions. Budget 2 to 5 days of work spread over 4 weeks for an e-commerce small business.
Contents
- Prerequisites: what you need before optimizing your Core Web Vitals
- Step 1, Diagnose your Core Web Vitals with Lighthouse and Search Console
- Step 2, Fix LCP: the metric that matters most
- Step 3, Fix INP: interaction smoothness
- Step 4, Fix CLS: visual stability
- Step 5, Track your Core Web Vitals over time
- Common mistakes that undo your Core Web Vitals work
- Frequently asked questions
Prerequisites: what you need before optimizing your Core Web Vitals
Before you open Lighthouse, set the frame. Without one, you spin in circles between 40 metrics and fix nothing.
Know the 3 thresholds to hit (LCP < 2.5s, INP < 200ms, CLS < 0.1)
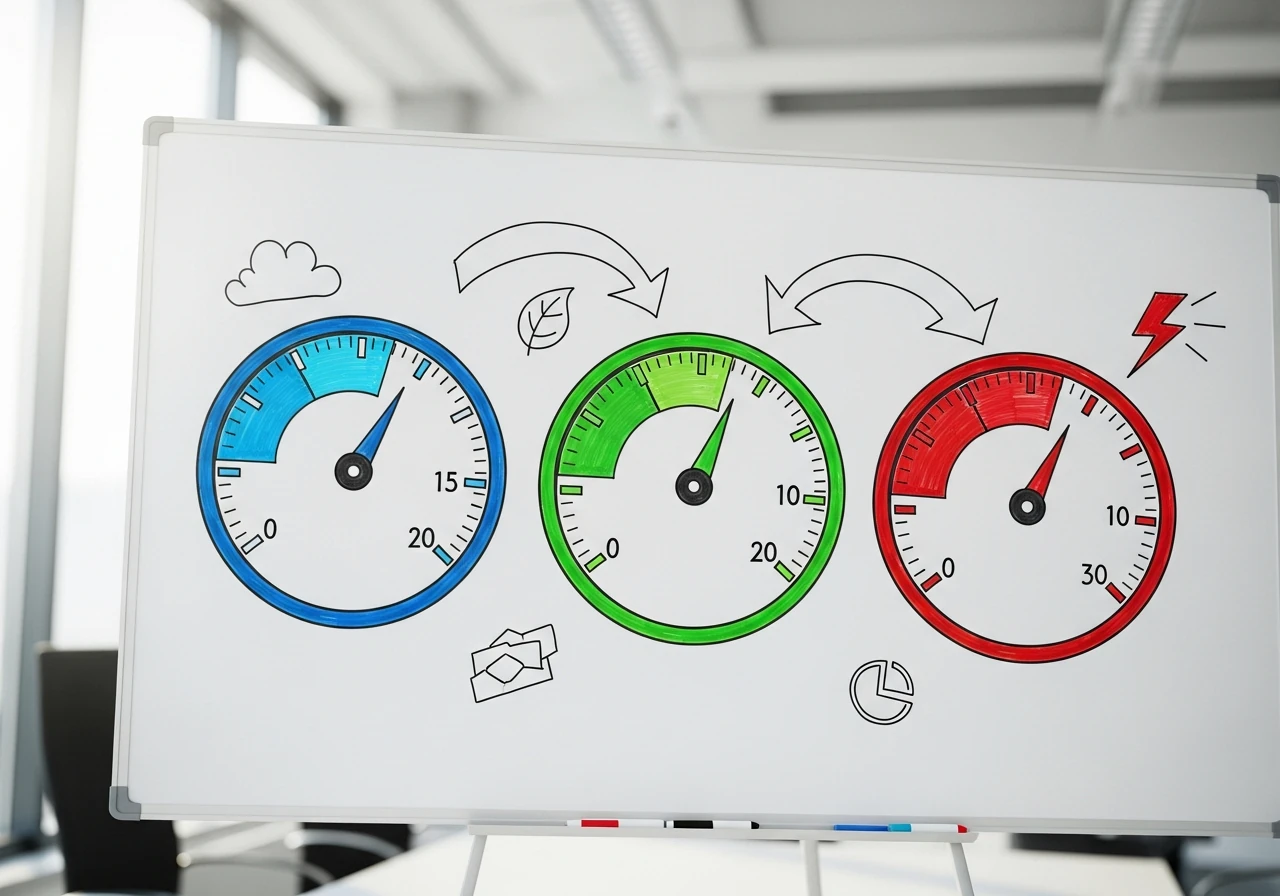
Three metrics tell the story of how fast your site feels. LCP (how long the main content area, usually the hero image or headline, takes to display) should stay under 2.5 seconds. INP (the delay between a click and the page's visible reaction) should stay under 200 milliseconds. CLS (visual stability: elements that jump around while the page loads) should stay under 0.1.
These thresholds aren't arbitrary. They're set by Google Search Central's official Core Web Vitals documentation, based on behavior observed across billions of pages through the Chrome User Experience Report.
| Metric | Good | Needs improvement | Poor |
|---|---|---|---|
| LCP | < 2.5 s | 2.5 to 4 s | > 4 s |
| INP | < 200 ms | 200 to 500 ms | > 500 ms |
| CLS | < 0.1 | 0.1 to 0.25 | > 0.25 |
Have access to Search Console and PageSpeed Insights
Two accounts are enough to get started: Google Search Console (a verified property on your domain) and PageSpeed Insights (no account needed). If your site runs on WordPress or Shopify, also check that you have back-office access to install or disable plugins. Without that access, you'll diagnose problems you can never fix. A blunt truth, but a real one.
Identify the high-traffic pages to prioritize
In practice, I see the same mistake over and over: an owner who wants to "optimize the whole site." Bad idea. Focus your effort on the 10 pages that drive 80% of your SEO traffic. Go to Search Console, open the "Performance" report, sort by clicks descending, and export the top 10. That's your working scope. The rest can wait.
What this means for you: on a small e-commerce site of around 200 pages, this scoping turns a 3-month project into a 3-day sprint spread over 4 weeks. You cover 80% of what actually moves SEO with 15% of the effort.
Step 1, Diagnose your Core Web Vitals with Lighthouse and Search Console
You can't fix what you haven't measured. This step takes about 90 minutes for 10 pages.
Read the "Core Web Vitals" report in Search Console
Log into Search Console. In the left menu, go to "Experience," then "Core Web Vitals." Two charts appear: Mobile and Desktop. Focus on Mobile. Why? Because Google has indexed mobile-first since 2021, and most e-commerce traffic goes through mobile, according to Médiamétrie's 2025 barometer.
The report sorts your URLs into three categories: Good, Needs improvement, Poor. Click "Needs improvement" and "Poor" to see the details. Google groups similar URLs together; if one URL is flagged, its neighbors (same template) probably share the same problem.
Run a Lighthouse audit page by page
Open Chrome, go to the page you want to diagnose, right-click, and select "Inspect." Open the "Lighthouse" tab, check "Performance" and "Mobile," then click "Analyze page load." You get a score from 0 to 100 with a metric-by-metric breakdown. Export the report as JSON or HTML to keep for reference.
Do this for your 10 priority pages. Budget 3 minutes per page. You'll come out with a clear map of what's failing and where.
Tell field data (CrUX) apart from lab data
This is THE distinction nobody explains to you. Lighthouse runs a simulation: your machine, your connection, at one moment in time. That's lab data. The Chrome User Experience Report (CrUX) aggregates real data from Chrome users who've opted into collection, over a rolling 28-day window. That's field data.
Google ranks on field data only. You can have a Lighthouse score of 95 and still see "Needs improvement" for CWV in Search Console. It happens often. The official Chrome User Experience Report documentation confirms it: only real user sessions count for ranking.
What this means for you: never celebrate a good Lighthouse score on its own. Wait 28 days after your fixes and check Search Console. That's what tells the truth.
Step 2, Fix LCP: the metric that matters most
Across the accounts I work with, LCP is the main culprit 7 times out of 10. The good news: it's also the easiest one to fix.

Identify the LCP element with Lighthouse
In your Lighthouse report, the "Largest Contentful Paint element" section names the exact element responsible. For 80% of small WordPress or Shopify sites, it's a hero image. For 15%, it's an H1 text block. For 5%, it's a background video.
Optimize the main image (WebP format, sizing, no lazy loading for LCP)
Three fixes, in this order. First, convert the image to WebP (a modern format 25 to 35% lighter than JPEG at equal quality). On WordPress, plugins like ShortPixel or Imagify do this automatically; on Shopify, it's been native since 2022.
Next, resize it. A 3,000px-wide hero image displayed at 1,200px wastes 60% of its file size for nothing. Serve the right size to each device with the srcset attribute. Third point, and this one's counter-intuitive: never lazy-load your LCP image. Lazy loading delays it, which drags down LCP. Save lazy loading for images below the fold.
On an e-commerce project last year (a fashion store with a team of 12), switching an 820KB JPEG hero image to a 145KB WebP file cut LCP by 1.1 seconds on average over a 4G connection. One single fix, a massive gain.
Cut server response time (TTFB) and preload critical resources
TTFB (Time to First Byte, the time between your click and the server's first response) should stay under 800 ms. Beyond that, your hosting is the problem. On low-end shared WordPress hosting, TTFB often exceeds 1.5 seconds. Switching to hosting with built-in server-side caching (Kinsta, WP Engine, or similar) cuts that number by 2 to 3 times.
Then add a <link rel="preload"> tag for your LCP image. You're telling the browser: "load this first." Typical gain: another 200 to 400 ms.
| LCP lever | Effort | Average gain | Who it's for |
|---|---|---|---|
| Hero image in WebP | 1h | 0.8 to 1.2 s | Everyone |
| Resizing with srcset | 2h | 0.3 to 0.5 s | Everyone |
| Hosting with caching | 1 day | 0.5 to 1 s | TTFB > 1s |
| Preload resources | 30 min | 0.2 to 0.4 s | LCP image |
What this means for you: a small business site that improves LCP from 4.2 s to 1.9 s typically gains 10 to 15% in mobile conversion rate, according to benchmarks published by HTTP Archive's 2024 Web Almanac. For a site doing €50,000 in monthly revenue, that's €5,000 to €7,500 a month, without spending a euro on ads.
Lysible tracks your Core Web Vitals continuously and connects their evolution to your real conversion rate, so you can put a number on gains like this without waiting for a one-off audit.
Step 3, Fix INP: interaction smoothness
INP replaced FID in March 2024 and is still widely misunderstood in 2026. Many sites that used to pass FID now fail INP, because the new metric is far more demanding.
Spot the heavy third-party scripts (chat, analytics, A/B testing)
INP measures how long your page takes to respond to a click, a tap, or a keystroke. Culprit number one on small business sites: third-party scripts. Meta Pixel, Hotjar, chatbots like Crisp or Tawk.to, A/B testing tools like Convertize, popups like Sumo. Each one adds 30 to 150 ms of main-thread blocking.
Take inventory. In Chrome DevTools, open the "Performance" tab, record 10 seconds of interaction, and look at the "Long Tasks." You'll see exactly which script is eating your INP. When I audit an e-commerce small business, I typically find 8 to 12 active third-party scripts, 3 to 5 of which haven't been used in months.
Defer or remove non-critical JavaScript
Three concrete actions. Remove scripts whose data you never look at (a Hotjar install from 2023 nobody's checked since: cut it). Defer scripts with defer or async, so they load after the critical interaction. Route everything through Google Tag Manager to centralize your tags and fire them after DOMContentLoaded instead of on page open.
The 3-question rule before adding any new third-party script: (1) Who will look at this data? (2) How often? (3) What decision will it drive? If any one of those answers is unclear, you don't add the script.
This same logic of cross-referencing data is exactly what we dig into in our web analytics method for small businesses: fewer tags, better used.
Test INP on mobile in real conditions
INP behaves very differently on desktop versus mobile. A mid-range smartphone (throttled CPU, limited RAM) struggles 3 to 5 times more than a MacBook Pro. Install the Chrome "Web Vitals" extension, enable it on your phone via remote Chrome debugging, and browse your site. You'll see INP update in real time.
Recently, I saw a client dashboard (a small construction business, about 20 pages) show a fine INP on desktop and a terrible one on mobile, purely because of a chat widget loading synchronously. Two lines of config in Tag Manager, problem solved.
What this means for you: in practice, across the accounts I've audited, removing 2 to 3 unused marketing scripts gains 80 to 150 ms of INP. That's often the difference between "Needs improvement" and "Good" in Search Console.
Step 4, Fix CLS: visual stability
CLS is the easiest metric to fix but the most neglected. Three causes cover 90% of the cases I see on small business sites.
Reserve space for images and iframes
When an image loads without declared dimensions, the browser doesn't reserve space for it. When it finally arrives, it pushes everything below it down. Shift. Frustration. CLS spikes.
Solution: on every <img> tag, add width and height in pixels (not %). Same for <iframe> elements (embedded YouTube, Google Maps). The browser reserves the space and nothing jumps anymore. On modern WordPress, this has been automatic since version 5.5; on older themes, it may require a template rework.
Get web fonts under control (font-display: swap)
Google Fonts loaded with default settings cause FOIT (Flash of Invisible Text) or FOUT (Flash of Unstyled Text): a fallback font shows first, then the real font kicks in and every line of text reflows.
Add font-display: swap to your CSS and pick a fallback font with matching metrics. With web.dev's official font-comparison tool, you can find a pairing that doesn't shift anything.
Ban banners and pop-ups that shift your content
Badly coded cookie banners, promo banners that push down from the top, pop-ups that shove the content around: all CLS killers. Solution: use position: fixed or position: absolute for these elements. They float above the content instead of pushing it.
Last year, on a fashion e-commerce site, I watched CLS drop from 0.28 to 0.06 just by repositioning a promo banner that had been inserted with position: static above the header. One line of CSS, and two weeks later Search Console flipped to green.
| CLS cause | Visible symptom | Fix | Technical level |
|---|---|---|---|
| Images without dimensions | Text jumps around | width/height in HTML | Easy |
| Web fonts | Text reflows | font-display: swap | Medium |
| Cookie banner | Content pushed down | position: fixed | Easy |
| Dynamic ads | Blocks appear suddenly | Container min-height | Medium |
What this means for you: a CLS under 0.1 doesn't just help SEO. It also lowers your mobile bounce rate, because nobody likes tapping the wrong button when the page has just jumped. Expect a 5 to 10% drop in bounce rate after fixing it.
Step 5, Track your Core Web Vitals over time
The classic trap: you optimize once, then everything slides back the moment you add a new plugin or marketing tag. A monthly ritual prevents that.
Set up a monthly check-in (Search Console + Lighthouse)
Block 1 hour a month on your calendar. The first Monday of the month works well. Three things to do: capture the Core Web Vitals report from Search Console, run a Lighthouse audit on your 5 top-traffic pages, and compare against last month in a simple spreadsheet.
To go further on the periodic-review method, our complete guide to Google Analytics covers how to cross-reference these metrics with your GA4 business data.
Set up alerts for regressions
You can't monitor this manually 24/7. Monitoring tools (Calibre, SpeedCurve, or the native features of some SaaS stacks) send an email the moment a metric slips. Set your alert thresholds 10% below your targets: if LCP goes above 2.75 s, you get warned before Search Console turns red.
Log every deployment
Keep a simple log: date, action taken (new plugin, new tag, template rework), expected impact. When you spot a CWV regression, you cross-check the log and find the cause in 5 minutes instead of 5 hours.
In early 2026, a small consulting firm client (a showcase site of about 30 pages) told me they'd lost 3 weeks chasing an LCP regression. The cause: a form plugin added by an assistant, with no entry in the log. The log has been kept religiously ever since.
What this means for you: this monthly ritual turns optimization into a habit instead of a one-off project. You'll never again pay €2,000 for an outside audit to tell you "your images are too heavy." You'll already know.
Common mistakes that undo your Core Web Vitals work
Six mistakes come up again and again when I audit small business sites that have "already been optimized."

Mistake 1: optimizing the Lighthouse score without looking at field data. Symptom: a 95 lab score, "Needs improvement" CWV in Search Console. Cause: Lighthouse simulates an ideal connection and an average device; your real users are on degraded 4G with entry-level Android phones. Fix: watch Search Console, not Lighthouse.
Mistake 2: installing an "all-in-one" plugin that breaks the layout. Symptom: your site is faster, but the mobile menu no longer opens. Cause: aggressive caching plugins minify JavaScript and break dependencies. Fix: test each setting in isolation, and only keep the ones that work without breaking anything.
Mistake 3: neglecting mobile even though Google indexes mobile-first. Symptom: the site is perfect on desktop, poor on mobile. Cause: tests run only on desktop. Fix: run every Lighthouse test in mobile mode, full stop.
Mistake 4: assuming a CDN fixes everything. Symptom: Cloudflare is enabled, but LCP is still poor. Cause: a CDN speeds up static delivery but doesn't fix an oversized image or a blocking script. Fix: optimize at the source, the CDN is only an accelerator, not a cure.
Mistake 5: optimizing once and forgetting about it. Symptom: 6 months after optimization, you're back to square one. Cause: plugins and marketing tags piling up one after another. Fix: the monthly ritual from Step 5.
Mistake 6: a full rebuild instead of targeted fixes. Symptom: a €15,000 quote to "rebuild the site." Cause: a vendor overestimating what's actually needed. Fix: 80% of CWV issues get solved without a rebuild. Ask for a targeted website audit first, before committing to any major project.
What this means for you: avoiding these 6 mistakes typically saves 60% of what an outside vendor would charge for optimization. You run the method in-house and keep control.
Scale up Core Web Vitals monitoring with Lysible
The monthly ritual in this guide works. But keeping it up over time, without missing a page or a regression, is exactly where small businesses without a dedicated tech team tend to drop off after 3 months.
Lysible brings Lighthouse, Search Console, and GA4 together in a single dashboard built for small businesses. You watch your Core Web Vitals evolve month after month across all your top-traffic pages, with automatic alerts on any drop and monthly reporting ready to present at a management meeting. To go further on automation, our guide to automated SEO audits covers the hybrid AI + monitoring workflow behind this approach.
Frequently asked questions
How do I test my Core Web Vitals for free?
Three free tools are enough. PageSpeed Insights (pagespeed.web.dev) gives you a score in 30 seconds for any public URL, with both lab and field data. Google Search Console (free with a verified property) provides the Core Web Vitals report for your whole site, using field data from CrUX aggregated over 28 days. Chrome DevTools (built into the browser) lets you run Lighthouse locally and measure under controlled conditions. For ongoing, free tracking, the "Web Vitals" Chrome extension shows all three metrics live as you browse. These tools cover 95% of what a small business needs.
Why does my Core Web Vitals assessment fail even though PageSpeed shows a good score?
Because Google only ranks based on field data (the Chrome User Experience Report), not Lighthouse's lab data. Lighthouse simulates an ideal session on a standardized machine. Your real users are browsing on mid-range smartphones over degraded 4G, sometimes 5G, with extensions and antivirus software running. The gap shows up often: a Lighthouse score of 95, "Needs improvement" CWV in Search Console. The rule: never trust the Lighthouse score for SEO purposes, only look at the Core Web Vitals report in Search Console, which is based on your real Chrome users' actual sessions.
What are the LCP, INP, and CLS thresholds to aim for in 2026?
Google's thresholds have been stable since INP arrived in March 2024. LCP (Largest Contentful Paint, how fast the main content area displays) should stay under 2.5 seconds. INP (Interaction to Next Paint, the reaction delay after a click) should stay under 200 milliseconds. CLS (Cumulative Layout Shift, visual stability) should stay under 0.1. Beyond that, Google marks the URL as "Needs improvement," between 2.5 and 4s for LCP, 200 to 500ms for INP, 0.1 to 0.25 for CLS. Further still, the "Poor" label appears. For a URL to pass the overall assessment, 75% of user sessions must meet all three thresholds at once, over a rolling 28-day window.
How long does it take to optimize the Core Web Vitals of a small business site?
Budget 2 to 5 days of work spread over 4 weeks for an e-commerce site of 150 to 300 pages. A typical breakdown: half a day for diagnosis and scoping, 1 day for LCP fixes (images, hosting, preload), 1 day for INP cleanup (auditing and removing unused third-party scripts), half a day for CLS fixes (image dimensions, fonts, banners), and half a day for testing and validation. Spreading it over 4 weeks lets Google's CrUX field data catch up. For a showcase site under 50 pages, budget 1 to 2 days total. A WordPress site on low-end shared hosting may need 1 extra day for a hosting migration.
Did INP really replace FID, and what does that change?
Yes, INP replaced FID (First Input Delay) as the official Core Web Vitals metric in March 2024. The change is significant. FID only measured the delay of the first click, which was easy to optimize for. INP measures the worst reaction delay across the entire user session, which is far more demanding. The practical consequence: many sites that used to pass FID without issue now fail INP, especially those loaded with marketing scripts (chatbots, A/B testing, ad pixels). E-commerce sites are hit particularly hard. The fix involves systematically auditing and cleaning up third-party scripts, and deferring their loading until after the critical interaction.
Do Core Web Vitals really affect Google rankings?
Yes, but with nuance. Google confirmed in May 2021 that Core Web Vitals are part of the "Page Experience" signals used for ranking. The impact isn't as heavy as content relevance or backlinks, but it becomes decisive when relevance is equal. On competitive queries where several results match the search intent equally well, Core Web Vitals break the tie. For a small business, the business impact is usually stronger on conversion rate than on pure ranking: an LCP improvement from 4s to 2s typically lifts mobile conversion rate by 10 to 15%, according to Web Almanac benchmarks. SEO benefits as a bonus.
Which tools should I use to track Core Web Vitals over time?
To get started for free: Google Search Console (automatic monthly report) plus manual Lighthouse audits on your 5 top-traffic pages. To automate without coding: the "Web Vitals" Chrome extension for quick checks, WebPageTest for deeper tests. For teams that want to scale this up: SaaS monitoring tools like Calibre, SpeedCurve, or platforms like Lysible bring Lighthouse, Search Console, and GA4 together in a single dashboard with automatic alerts on regressions. The advantage of a SaaS tool: you keep a month-by-month history, which is valuable for pinpointing regressions tied to successive deployments.
Do I need a developer to fix my Core Web Vitals?
No, not for 80% of fixes, yes for the remaining 20%. What you can do without a developer: compress and convert images to WebP (WordPress plugins like ShortPixel), disable unused marketing scripts, add dimensions to images through your content editor, reposition a promo banner with position: fixed. What needs a developer or integrator: preloading critical resources in HTML, reworking how web fonts load, optimizing the main JavaScript thread, setting up inline critical CSS. The right approach: handle the accessible 80% first, measure the result, then decide whether the developer investment is worth it for the remaining 20%.

Isaac SIKORSKI
With Lysible, I want to give businesses back control of their online presence. A website you actually understand is one that brings in real opportunities.