Landing page conversion audit: a 6-step data method
An effective landing page conversion audit combines four data sources: user behavior in GA4, speed measured with Lighthouse, attention revealed by a heatmap, and the quality of the message. Most pages stall between 3% and 6% without this structured diagnosis. The method comes down to six steps: set a goal, read the leaks, measure performance, watch the clicks, put the copy under scrutiny, then prioritize fixes with an impact/effort matrix. An LCP above 2.5s or a CLS above 0.1 directly hurt conversion.

Key takeaways
- Most landing pages stay stuck between 3% and 6% conversion because they lack a structured audit of message, UX and performance.
- A reliable audit combines 4 sources: GA4 (behavior), Lighthouse (speed), heatmaps (attention) and copywriting analysis.
- An LCP above 2.5s and a CLS above 0.1 directly hurt conversion: these are Core Web Vitals thresholds to fix first.
- The GA4 funnel reveals where users drop off: each lost step is often worth more than changing a button color.
- Prioritize fixes with an impact/effort matrix: quick wins (above the fold, CTA, speed) come before a full redesign.
Contents
- Before the audit: gather your data and set a conversion goal
- Step 1, Read real behavior in GA4 and spot the leaks
- Step 2, Measure speed and Core Web Vitals with Lighthouse
- Step 3, Analyze attention with heatmaps and session recordings
- Step 4, Put the message, the CTA and the proof under scrutiny
- Step 5, Prioritize fixes with an impact/effort matrix
- The mistakes that skew a conversion audit
- Take back control of a page that costs you sales every month
- Frequently asked questions
Before the audit: gather your data and set a conversion goal
A serious landing page conversion audit starts with a target number, not a hunch. Without a benchmark, there's no way to tell whether your page is failing or simply sitting within your industry's norm.
The average e-commerce conversion rate in France sits between 1.5% and 3% depending on the sector, with the top 20% of stores passing 3.2%, as shown in our e-commerce conversion rate statistics for France. A dedicated landing page, better targeted than a generic product page, aims higher: 4% to 6% for lead generation, sometimes more on a short form. But a page at 3% isn't necessarily broken. A page at 0.5% with 2,000 monthly visitors is.
What conversion rate should you aim for on a landing page?
Set a goal relative to your starting point, not to some mythical figure. If your page converts at 1.2%, aiming for 2% in three months is realistic and profitable. Doubling a weak rate always pays off faster than squeezing a few tenths out of an already strong page.
The real trap: comparing your page to a study covering an industry that isn't yours. A SaaS landing page and a shoe sales page don't follow the same rules. Take your own 90-day average as your internal benchmark.
Which tools should you set up before starting (GA4, Lighthouse, heatmap)?
Four free tools cover 90% of the diagnosis. Google Analytics 4 for behavior, Lighthouse for speed, a heatmap tool like Microsoft Clarity or Hotjar for attention, and your own critical read for the message.
First of all, check that your tracking isn't broken. A duplicated tag or an unfiltered internal IP skews everything else. I never launch an audit without checking that data collection is clean, because a wrong number steers you toward bad decisions for weeks. The common GA4 mistakes in small businesses can be fixed in under an hour and save you from auditing on faulty data.
To set up event tracking without touching code, Google Tag Manager remains the recommended route. Budget half a day to install everything cleanly the first time.
Step 1, Read real behavior in GA4 and spot the leaks
The GA4 funnel reveals the exact spot where visitors give up. That information is often worth more than a full visual redesign. It's the first reflex of any audit.
Open the Explore section, create a funnel exploration, then set your key steps: landing on the page, scroll to 50%, click on the CTA (the main button), form displayed, submission. GA4 then shows you the drop-off percentage between each step. The official Google Analytics documentation on funnel explorations details how to build it step by step.
How do you find out where visitors abandon my landing page?
Look at the funnel step where the drop is sharpest. That's your priority leak point. A 70% loss between the form being displayed and its submission won't be fixed by changing the page title: the problem is in the form itself.
Here's a case I run into regularly. A store with a small catalog sends Google Ads traffic to a collection page. The funnel shows 100% arrivals, 40% scrolling below the fold, then only 8% clicks on a product. The massive drop-off happens before the first visible item. Two combined causes: a load time that was too long on the main image, and a headline that didn't echo the promise made in the ad. Fixing those two points (only those two) pushed the product click rate up to 19% the following quarter. No button color change anywhere in there.
Which GA4 reports should you use for a conversion audit?
Three reports are enough. The funnel exploration for leaks, the Pages and screens report for engagement rate and average time, and the Traffic acquisition report to check where the visitors who don't convert are coming from.
Always cross these views. A high bounce rate on paid traffic often signals a mismatch between the ad and the page. On organic traffic, it can instead signal a misunderstood intent. To go further on the metrics that really matter, our website traffic statistics to track first help you avoid drowning in data.
Step 2, Measure speed and Core Web Vitals with Lighthouse
A slow page loses sales before the visitor has even read your offer. Every extra second of waiting drives away a fraction of your prospects. It's measurable, quantifiable and fixable.
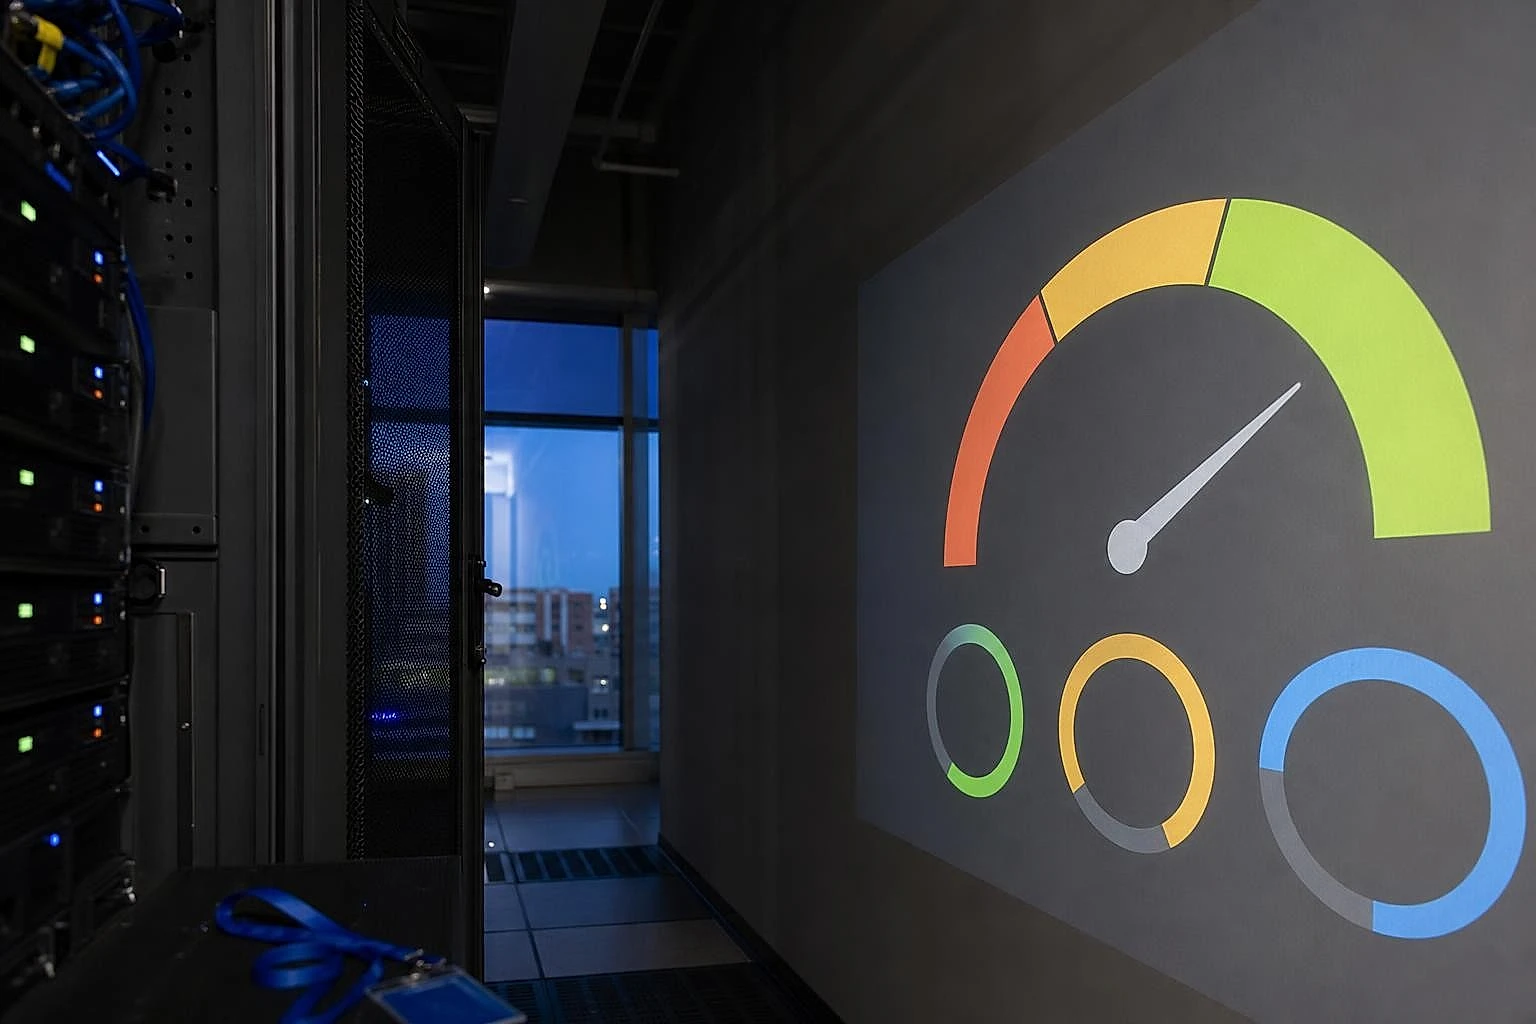
Open Lighthouse (the performance audit built into Chrome, also available through PageSpeed Insights) and run the test on mobile first. Most of your traffic is mobile, and that's where speed problems do the most damage. You get a score out of 100 and, above all, the breakdown of Core Web Vitals, Google's three official metrics for perceived performance.
Does a slow site really lower conversions?
Yes, and the effect is direct. Google documents on web.dev that Core Web Vitals thresholds are tied to engagement and conversions. A page that exceeds those thresholds discourages impatient visitors, especially on mobile where the connection is often weaker.
Let's put it in concrete terms. If your page takes 4 seconds to display its main area instead of 2, some of your visitors close the tab before they've seen your offer. On 1,000 monthly visitors, even a 5% leak means 50 contacts or carts lost every month, without you seeing it in your sales figures.
Which LCP, CLS and INP thresholds should you aim for?
Three thresholds to remember, all restated in plain terms.
| Metric | Good threshold | What it measures |
|---|---|---|
| LCP | Under 2.5s | How fast the main area displays |
| CLS | Under 0.1 | Visual stability (nothing shifts under your finger) |
| INP | Under 200ms | Delay between the click and the page's reaction |
LCP (Largest Contentful Paint) is the one most tied to conversion: it's the moment the visitor finally sees your content. CLS (Cumulative Layout Shift) measures those annoying jumps where a button moves just as you tap it. INP (Interaction to Next Paint) captures how responsive the page feels on tap. If I could only tackle one metric first, it would be mobile LCP: it's almost always the most profitable lever in a technical audit.
Step 3, Analyze attention with heatmaps and session recordings
A heatmap shows what GA4 will never see: where the eye stops, how far people scroll, which elements they click in vain. It complements the numbers, it doesn't duplicate them.
Install Microsoft Clarity (free, with no session limit) or Hotjar. You get three views: the click heatmap, the scroll map that shows how far visitors go down the page, and session recordings where you watch a real journey unfold in real time.
What is a heatmap for in a landing page audit?
It reveals frictions invisible in the numbers. A classic example: the scroll map shows that 80% of visitors never go below the fold. Your carefully crafted argument at the bottom of the page serves no one. You need to move the key points up.
The most useful signal remains the dead click: people click on an image, a title, an underlined word that isn't a link. They expect an action that doesn't exist. Every dead click is an expressed and frustrated need (and it can be fixed in ten minutes if you know where to look). I always spot these zones first, because they show precisely what the visitor is trying to do.
Cross the heatmap with your GA4 funnel. If the drop-off happens before the form and the scroll map shows abandonment at the same spot, you've found your culprit. Recordings then confirm the why. The Nielsen Norman Group documents these attention and F-shaped reading patterns extensively, a solid reference for interpreting what you observe.
Step 4, Put the message, the CTA and the proof under scrutiny
For a site with modest traffic, message clarity matters infinitely more than the button color. Mainstream CRO consensus oversells micro visual tests when the real lever plays out in the first 5 seconds of reading.
Put yourself in the shoes of a visitor discovering the page for the first time. In under 5 seconds, do you understand what you sell, to whom, and why choose you? If the answer hesitates, no nicely colored button will save the conversion. The value proposition must be readable above the fold, without scrolling.
What makes a landing page headline effective?
An effective headline names the concrete benefit for the visitor, not the product feature. "Delivery in 24 hours anywhere in France" beats "Our cutting-edge logistics" every time. The headline should also echo the words of the ad or the query that brought the visitor: this continuity reassures and reduces the immediate bounce.
Try the perfect stranger test. Show your headline to someone who doesn't know your business. If they can't say what you do, rewrite it.
How many calls to action should you put on a page?
One action goal per page, repeated several times. A landing page that offers "Buy", "Request a quote" and "Sign up for the newsletter" all at once dilutes the decision. The result: the visitor chooses to do nothing.
Keep one main CTA, phrased in the visitor's first person ("Book my spot" often converts better than "Book"). Repeat it: once at the top, once after your social proof, once at the bottom. Social proof, precisely, must be specific. "4.8/5 from 320 reviews" carries more weight than "Our customers love us". On e-commerce pages, these same principles connect with our advice on how to increase online store sales without an ad budget, where optimizing the message always comes before buying traffic.
Step 5, Prioritize fixes with an impact/effort matrix
Faced with a list of ten problems, an impact/effort matrix tells you where to start without spending a month on it. It's the sorting that turns an audit into visible results.
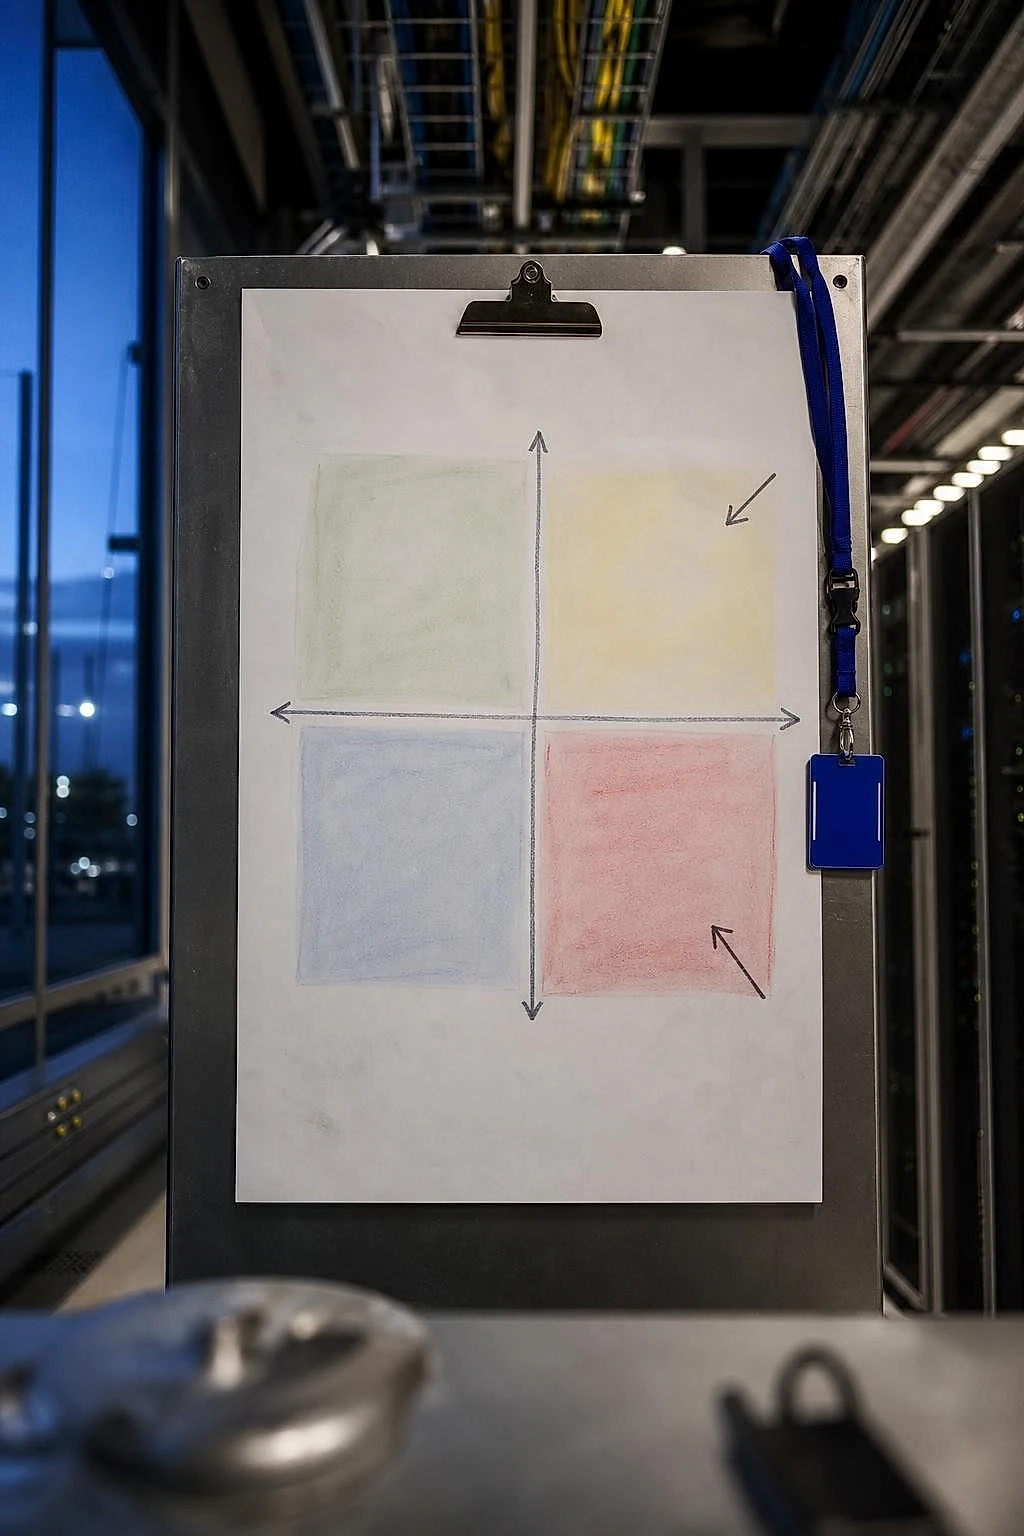
Rank each fix along two axes: the estimated impact on conversion and the implementation effort for your team, knowing that many small businesses don't have a dedicated developer. You get four quadrants.
| Quadrant | Impact | Effort | Action |
|---|---|---|---|
| Quick win | High | Low | Do this week |
| Project | High | High | Plan ahead |
| Detail | Low | Low | If time allows |
| Ignore | Low | High | Never start here |
Which fix should you start with when everything needs improving?
Always start with the quick wins above the fold. Rewriting a confusing headline, moving the CTA up, adding specific social proof, compressing images to improve LCP: these actions cost little and reach the most visitors, since everyone sees the top of the page.
A full redesign almost always falls into the project quadrant. It's tempting because it's visible, but it ties up weeks for an uncertain gain. I never recommend starting with a full overhaul: fix the identified leaks first, measure, then decide whether a redesign is still justified. Often, it no longer is.
This cross-referencing between GA4 data, the Lighthouse score and UX signals gets redone with every campaign, with every new page. Doing it by hand takes half a day per audit, or continuously if you automate the tracking of your metrics.
The mistakes that skew a conversion audit
Three mistakes silently invalidate an audit: too small a sample, broken tracking and an A/B test launched without a statistical basis. They make you believe in progress that doesn't exist.
The sample first. Auditing a page that gets 80 visitors a month yields no reliable conclusion. One or two extra purchases make the displayed rate jump without anything having changed on the page. Below a few hundred monthly visitors, rely on qualitative signals (heatmaps, session recordings) rather than percentages.
Why isn't my conversion rate moving after my changes?
Three causes come up. Your changes addressed a minor problem (the button color when the real barrier was speed). Your traffic is too low for the difference to show in the numbers. Or your tracking no longer measures conversion correctly since a change to the site.
A/B testing is the most common trap. It's appealing because the tools make it easy, because it looks like scientific rigor. Except a test needs thousands of visitors per variant to reach statistical significance. A site with modest traffic can wait months without ever getting a reliable result. At those volumes, fixing the message, speed and clarity pays off far faster than an endless benchmark on two shades of green. Save A/B testing for high-traffic pages.
Finally, check your tracking after every change. A moved form, a renamed CTA, a forgotten tag: your conversion "drops" when only the measurement broke. That's the check I systematically add last before drawing any conclusion from an audit.
Take back control of a page that costs you sales every month
At this point, you know how to read a GA4 funnel, interpret a Lighthouse score and a heatmap, prioritize your fixes. The real barrier is no longer the method: it's the time it takes to gather these four sources for every page, every campaign, every month. Open GA4, run Lighthouse again, open Clarity, cross-reference by hand, and eventually it just stops happening. A page left unwatched starts leaking again. Lysible brings these signals together in one place so a landing page audit becomes a routine of a few minutes again, not a project you keep putting off.
Frequently asked questions
How do you audit a landing page that won't convert?
Follow a six-part method. First, set a realistic conversion goal relative to your current average. Then read behavior in GA4 to spot where visitors drop off. Measure speed with Lighthouse, especially mobile LCP. Watch attention with a heatmap tool like Microsoft Clarity. Put the headline, the CTA and social proof under scrutiny. Finally, prioritize fixes with an impact/effort matrix. This approach combines four data sources and takes half a day for a first complete audit.
What is a good conversion rate for a landing page?
In French e-commerce, the average sits between 1.5% and 3% depending on the sector, with the top 20% passing 3.2%. A landing page dedicated to lead generation aims closer to 4% to 6%. But the right number stays relative to your starting point and your sector. A page at 3% can be normal, while a page at 0.5% with substantial traffic deserves an urgent audit. Always compare to your own 90-day average rather than to a study covering a business different from yours.
Does a slow site lower conversions?
Yes, directly. On web.dev, Google ties Core Web Vitals to engagement and conversions. A page whose main area displays in 4 seconds instead of 2.5 drives away part of your visitors before they see the offer, especially on mobile. The recommended threshold for LCP is 2.5 seconds. Beyond that, every slice of lost visitors means carts or contact requests missed every month. That's why speed is among the first fixes to handle in an audit, often the most profitable for the effort invested.
Which tools should you use for a conversion audit?
Four free tools cover the essentials. Google Analytics 4 for behavior and the conversion funnel. Lighthouse or PageSpeed Insights for speed and Core Web Vitals. Microsoft Clarity or Hotjar for the heatmap and session recordings. And your own critical read for the message. Add Google Search Console to check where your organic traffic comes from and Google Tag Manager to set up your conversion events cleanly. This combination is enough for the vast majority of small businesses, without paid software, provided you've first checked that your tracking isn't skewed.
How many calls to action should you put on a landing page?
One action goal, repeated several times. A page that offers to buy, request a quote and sign up for a newsletter all at once dilutes the decision, and the visitor ends up doing nothing. Keep a single main CTA, phrased from the visitor's point of view, and place it in three spots: at the top above the fold, after your social proof, and at the bottom of the page. Message consistency around this single action matters more than the number of buttons.
Why isn't my conversion rate improving after my changes?
Three main causes. Your changes targeted a minor problem, like the button color, when the real barrier was elsewhere (speed, message clarity). Or your traffic is too low to make the difference statistically visible: below a few hundred monthly visitors, percentages are misleading. Or your tracking broke after a change to the site, and you're measuring the real conversion poorly. Always check your tracking after every change and focus your efforts on the high-impact fixes identified by the GA4 funnel.
What is a heatmap for in a landing page audit?
A heatmap reveals what the numbers don't show: how far visitors scroll, where their gaze stops and which elements they click with no effect. The scroll map indicates, for example, whether your bottom-of-page argument is actually seen. Dead clicks, those clicks on non-clickable elements, signal an action the visitor is trying to take without success. Combined with the GA4 funnel, the heatmap confirms the exact drop-off point and its cause. Microsoft Clarity offers it for free and with no session limit, which makes it a good starting point for a small business.

Isaac SIKORSKI
With Lysible, I want to give businesses back control of their online presence. A website you actually understand is one that brings in real opportunities.